
Bitcoin Price Prediction: BTC/USD Closes to $34,000 Resistance
Bitcoin Price Prediction – July 11
The Bitcoin price is slightly under $34,000 amid the struggle to extend the bullish leg above the moving averages.
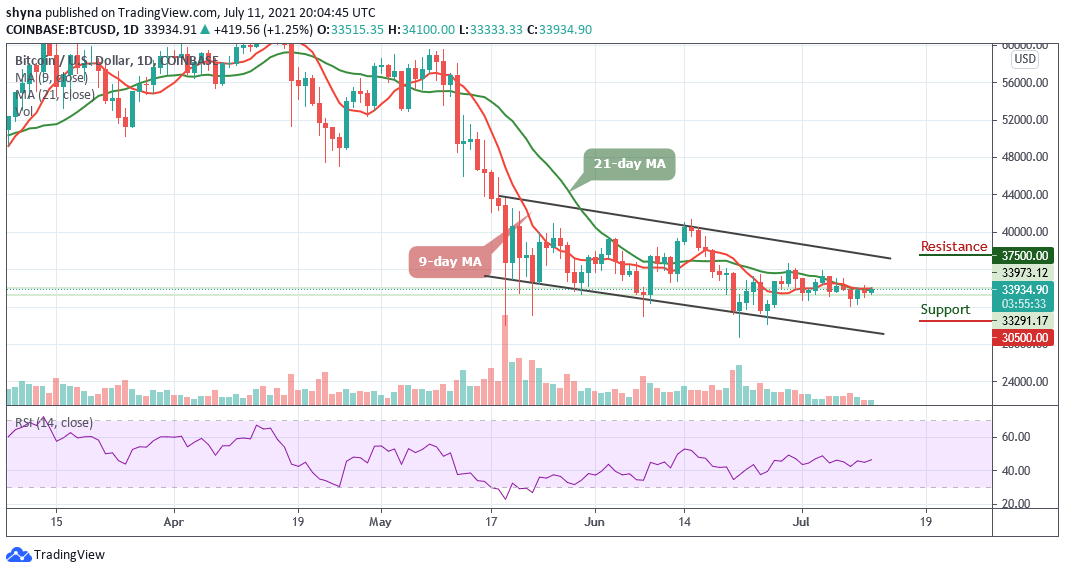
BTC/USD Long-term Trend: Ranging (Daily Chart)
Key levels:
Resistance Levels: $37,500, $39,500, $41,500
Support Levels: $30,500, $28,500, $26,500
BTC/USD has been in an ongoing uptrend since a couple of days ago, as the market price plans to cross above the 9-day and 21-day moving averages. Presently, the Bitcoin price is seen trading close to $34,000 resistance as the coin finds its way back to the top.
Bitcoin Price Prediction: Would Bitcoin Price Move Up?
The break above $34,000 is going to be a must for Bitcoin bulls as this will allow them to expand their scope above $35,000 which has always been a restriction for the coin. Note that Bitcoin price is hovering around the 9-day and 21-day moving averages, which could still bring massively bullish signals for the market soon. But if the price should slump below the 9-day and 21-day moving averages, the $35,000 level could be an important zone to keep an eye on. Once bulls flip this level into support, the next major supports for the world’s leading crypto could be $30,500, $28,500, and $26,500.
While the Bitcoin price begins to hover around the $33,934 level, there are two crucial price levels to pay attention to. The underlying support at $30,000 and the overhead resistance at $35,000 will help determine where prices are headed next as the potential resistance levels are located at $37,500, $39,500, and $41,500. Meanwhile, the technical indicator Relative Strength Index (14) suggests a sideways movement as the signal line moves above 45-level.
BTC/USD Medium-Term Trend: Ranging (4H Chart)
Looking at the 4-hour chart, the Bitcoin price needs to remain above the 9-day and 21-day moving averages to mitigate the short-term bullish pressure and allow for an extended recovery towards $34,000. In addition, a higher resistance level may be found at $35,000 and above.
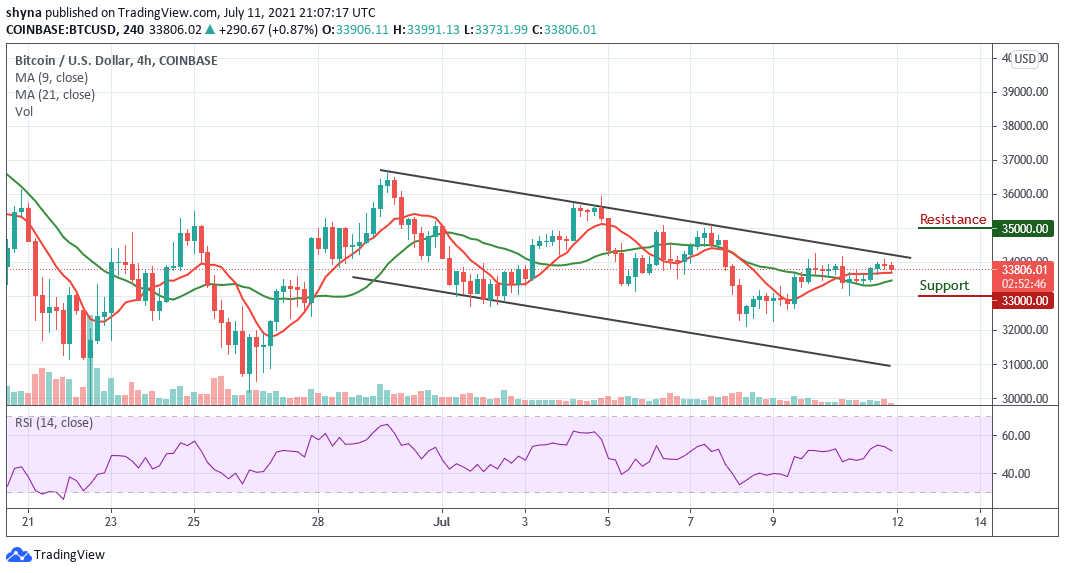
On the other hand, the nearest support is below the 9-day and 21-day moving averages at $33,806, and a critical move below this level may increase the downside pressure to the support level of $33,000 and below. Meanwhile, the technical indicator Relative Strength Index (14) is staring at the downtrend as the signal line moves below the 55-level.
Looking to buy or trade Bitcoin (BTC) now? Invest at eToro!
75% of retail investor accounts lose money when trading CFDs with this provider