Bitcoin (BTC/USD) Holds Values in Ranges
Bitcoin Price Prediction – July 10
The market operation involving Bitcoin and the US Dollar holds values in ranges at $35,000 and $30,000. The crypto’s worth stands around the level of $33,609 at a negative rate of about 0.70 percent.
BTC/USD Market
Key Levels:
Resistance levels: $37,500, $42,500, $47,500
Support levels: $30,000, $27,500, $25,000
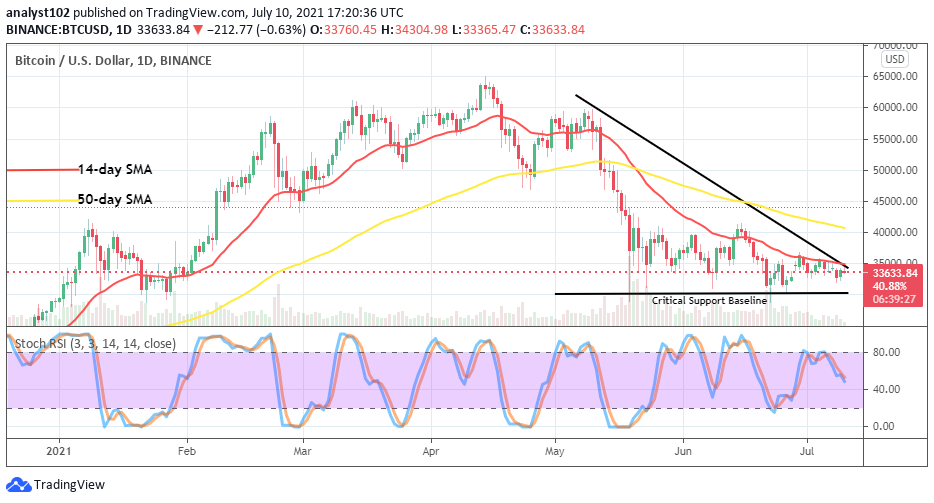
BTC/USD – Daily Chart
On the BTC/USD daily chart, the crypto economy holds values in definite range-bound levels. There is a line of variant features of lower-lows and lower-highs around the point of $35,000. The 14-day SMA with the bearish trend-line; conjoined underneath the 50-day SMA indicator. The Stochastic Oscillators are between the ranges of 80 and 40, trying to conjoin the lines as they still somewhat face southbound. That suggests that the market is still under pressure, making the upside movement difficult.
BTC/USD holds values in ranges, could there be a change in the market’s trend soon?
There has been no tangible price action in the BTC/USD operations as the market holds values in ranges. In accordance with the technical trading principles in a range-bound situation, bulls are majorly expected to be on the lookout for a reversal of downward moves from or around the lower range trading zone before considering joining the trade. In the event of that not forthcoming, bull-traders needed to stay off from placing an order for a while.
On the downside analysis, bears appear to be in the purview of looking for resistance as the BTC/USD market’s price gradually approaches other higher points near the $35,000. However, being as it is, there has been no violent motion to project a further free-fall in this crypto economy that may eventually push for the reliable continuation of bearish trend below the critical baseline at $30,000. Therefore, bears are to be wary of points around them.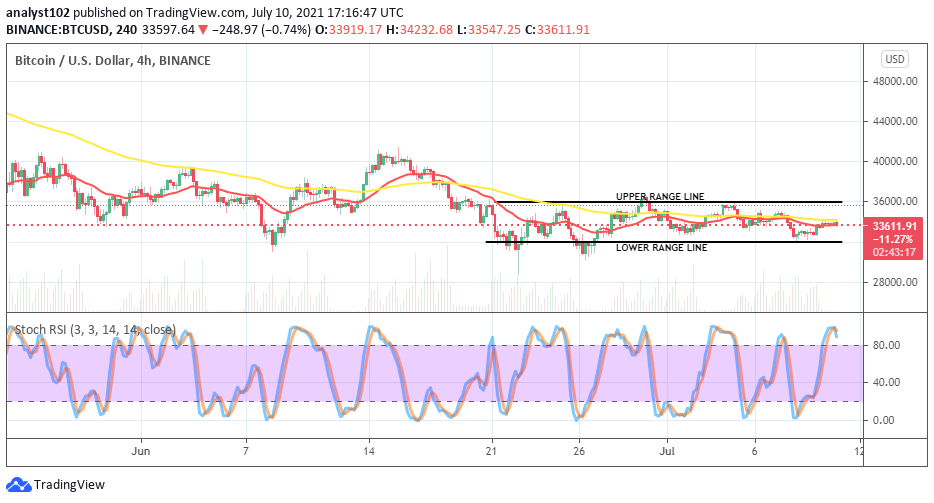
BTC/USD 4-hour Chart
About a couple of weeks, the BTC/USD market operation holds values in the ranges of $36,000 and $32,000, as depicted on the 4-hour trading chart. Those lines are with upper and lower range lines for demarcation of the range-bound trading zones. The 50-day SMA indicator has been conjoining underneath by the 14-day SMA trend-line. The Stochastic Oscillators are in the overbought region with the lines crossed southbound. That indicates that the crypto trade may soon begin to witness a degree of valuation reduction in its present range-bound trading points.
Looking to buy or trade Bitcoin (BTC) now? Invest at eToro!
75% of retail investor accounts lose money when trading CFDs with this provide