Bitcoin Price Prediction: BTC/USD Yet Witnesses Slight-Downward Correction Under the Vital Resistance of $40,000
Bitcoin Price Prediction – January 31
BTC/USD market valuation still trades in a relative-downward move around the value of $35,000 over a couple of weeks.
BTC/USD Market
Key Levels:
Resistance levels: $40,000, $45,000, $50,000
Support levels: $30,000, $25,000, $20,000
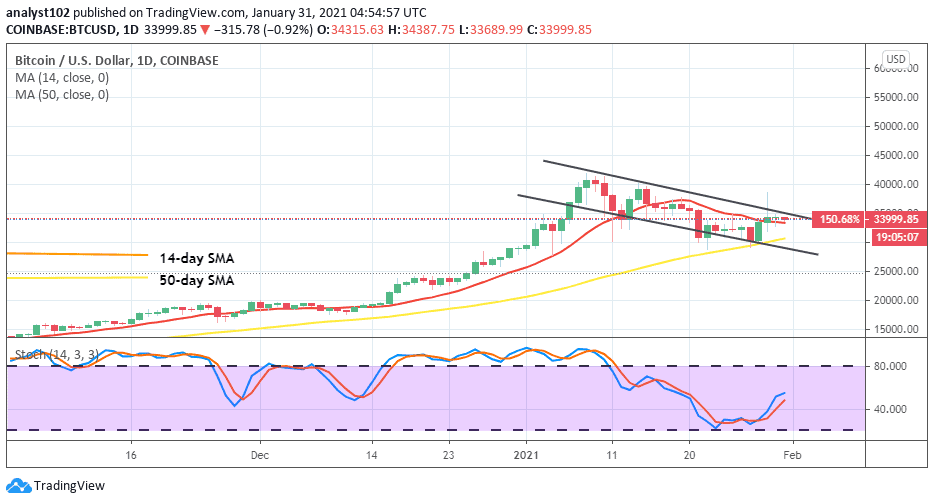
BTC/USD – Daily Chart
The BTC/USD daily trading chart slightly depicts a bullish-flag formation as price hasn’t sustainably moved down past a support level of $30,000. The 14-day SMA trading indicator now lays slightly flat closer to the 50-day SMA from the top as price hovers around it. The trading channels show that the market currently encounters a resistance around the $35,000 value. The Stochastic Oscillators have slowly moved up a bit over range 40. They are now attempting to cross the hairs around the range mentioned earlier. That suggests an ongoing kind of sideway moves in the crypto-economy.
What could be the next BTC/USD price action?
BTC/USD market now faces a necessary price-downward correction. Vital support is around the $30,000 level should the present assumed formation play out validly for a bullish trend. Therefore, bulls have to start pushing northbound to restage a bullish trend continuation in the crypto-market.
On the downside, bears will have to keep posing resistant-moves against any sudden upsurge between the market-trading levels of $35,000 and $40,000 in the next sessions. The market point at $30,000 needs a forceful break-down to allow some free sell-offs averaging the main support level around $20,000. However, sellers need to be wary of not getting trapped while placing a position.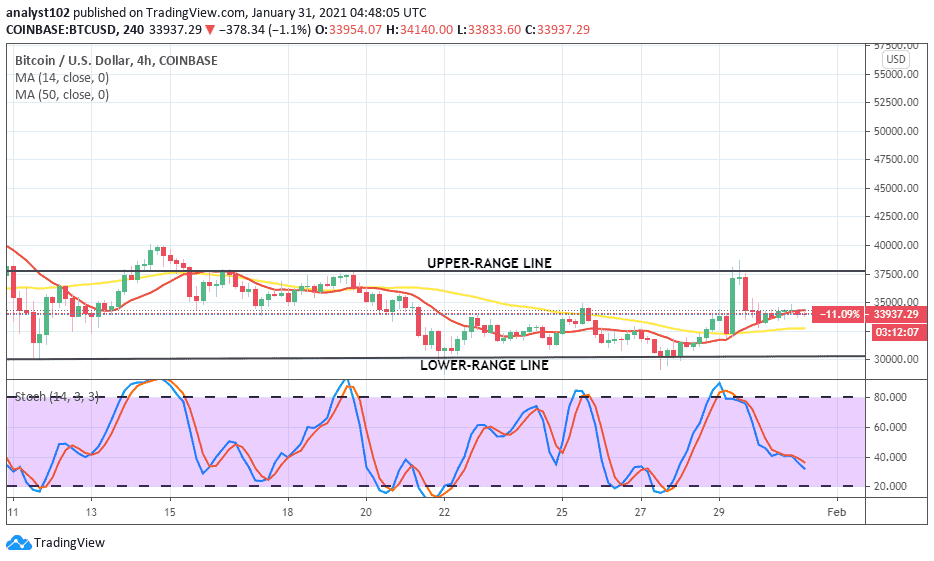
BTC/USD 4-hour Chart
There have been significant falls and rises around $30,000 and $38,000 price range-lines on the BTC/USD 4-hour trading chart since a few weeks back. On January 29, a spike occurred briefly touched past the upper-range line to average the resistance of $40,000. The 50-day SMA has crossed by the 14-day SMA to the north with a small space between them. They are within the trading channels. The Stochastic Oscillators are somewhat now pointing towards the south, a bit below range 40. Price may continue to build on a support line around $30,000 in the near trading operations. In the light of that, more ups are potentially imminent afterward.