
Bitcoin Price Prediction: BTC/USD Value Features in Ranges
Bitcoin Price Prediction – June 5
There have been definite lines that the BTC/USD value features in ranges over some trading operations. As of writing, the crypto’s market worth appears slightly overwhelmed by the purchasing power of the US Dollar to trade at a -1.36 percentage decrease at the level of $36,394.
BTC/USD Market
Key Levels:
Resistance levels: $40,000, $45,000, $50,000
Support levels: $35,000, $30,000, $25,000
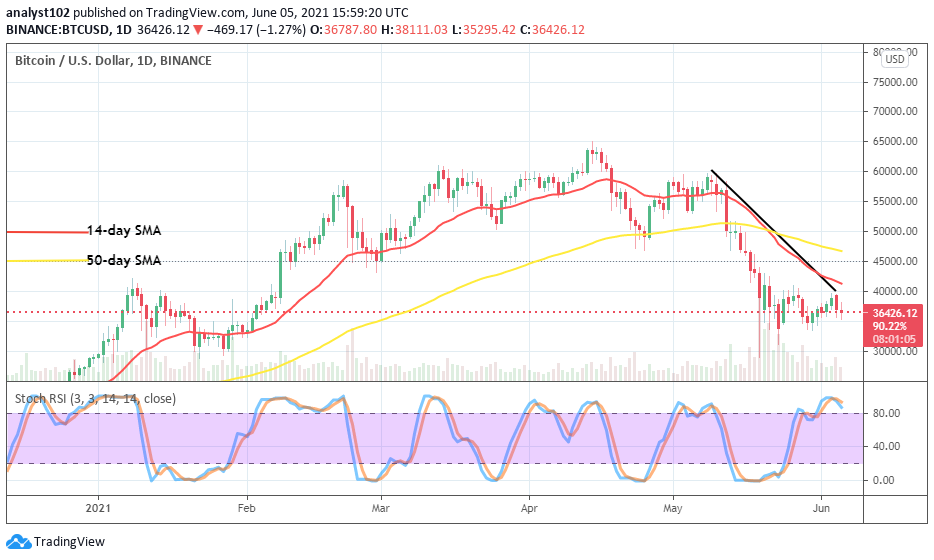
BTC/USD – Daily Chart
On the BTC/USD daily chart, as depicted, it is now imperative that the lines of $40,000 and $35,000 are needed to be made immediate resistance and support levels. Around those points, the crypto market’s value features in ranges. Currently, a very light bearish candlestick is in the making toward the immediate support level. As regards the indicators’ posture, there have been no tangible changes until the present. Both the bearish trend-line and the 14-day SMA trend-line are aligned downward to locate a position around the immediate resistance line as the 50-day SMA indicator is located over them a bit above the resistance level of $45,000. The Stochastic Oscillators are in the overbought region with a slight sign of crossing the lines toward the south to suggest that selling pressure is somewhat ongoing.
Now that the BTC/USD value features in ranges, will it be still prolonged indefinitely?
The crossing of the Stochastic Oscillators’ lines from the overbought region shows that the BTC/USD bulls’ capacity is being exhausted gradually to potentially give way to a falling pressure. As the crypto market features in ranges, around the levels of $40,000 and $35,000, signifies that those points are worthy of note by the two market movers. In the light of that, If price has to abide by the indicator’s reading, the lower range line will be breached downward to allow the market to locate reliable support in the process.
Being as it is, the market space is still to some extent dominated by bears’ pressures as price yet trades on the sell signal side of the indicators presently. Continual testing of the immediate resistance has given a decent sell entry of the crypto economy. In the meantime, however, a sudden breakdown of the immediate support level may cause bears’ profiteering situation that has every tendency of getting to a reversal move in no time.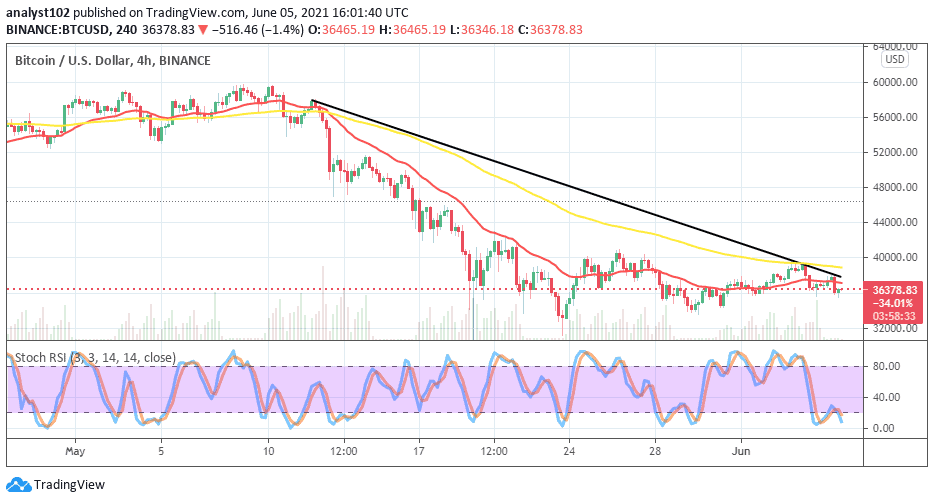
Looking to buy or trade Bitcoin (BTC) now? Invest at eToro!
BTC/USD 4-hour Chart
The BTC/USD medium-term chart shows that the crypto economy is trying to push slightly down around the level of $36,000. Nevertheless, all the indicators are in the $40,000 and $36,000 lines. The bearish trend-line drew across the 50-day SMA indicator from the top as the 14-day SMA trend-line is located underneath them close to the lower line. The Stochastic Oscillators are pointing to the south across range 20. Going by that reading, A downward pressure potentially seems to loom more for a while in the trading activities between Bitcoin and US fiat currency.
75% of retail investor accounts lose money when trading CFDs with this provider