Bitcoin Price Prediction: BTC/USD Trades in Ranges
Bitcoin Trades in Ranges– June 2
The trading levels around the $40,000 and the $35,000 have been the major zones where Bitcoin versus the US Dollar trades in ranges. The crypto’s price as of writing is seen at around $36,680 line at a 0.62% increase.
Trades in Ranges: BTC Market
Key Levels:
Resistance levels: $40,000, $45,000, $50,000
Support levels: $30,000, $25,000, $20,000
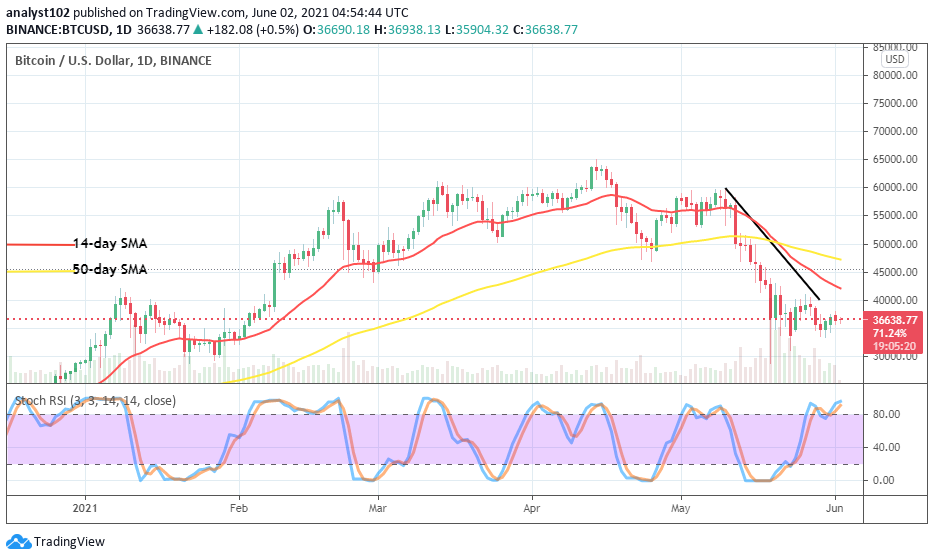
BTC/USD – Daily Chart
The BTC/USD daily chart now shows that the crypto market trades in ranges of around the levels of $40,000 and $35,000. Some of the past other times that price breached down the lower level has been to fake out such a move in no time. Like in the past sessions, the bearish trend-line remains drawn across the SMAs from the top as the 50-day SMA indicator is intercepted by the 14-day SMA trend-line. The Stochastic Oscillators are in the overbought region seemingly trying to close the hairs a bit above range 80. And that could at a later session turns into a consolidation moving sign to suggest that the downward pressure isn’t fully exhausted.
How long will it be, as BTC/USD trades in ranges?
Considering the technical reading of what the Stochastic Oscillators now signaling coupled with the current BTC/USD trades in ranges, the downward pressure seems not getting weak especially as bulls have been finding the main resistance of $40,000 difficult to breach northward over a couple of sessions. In that wise, decent buy orders would now have to feature at a lower value of around $35,000.
As regards the downsizing movement of the crypto’s valuation, continual pressure has to be mounted at the higher range level of $40,000. However, breaking out of that point is most crucial in determining an end to the recent southward forces that the market has faced. It is well observed that the value of $35,000 is now at a close range that could at no point in time breach further down to look for support around the immediate support level of $30,000 afterward.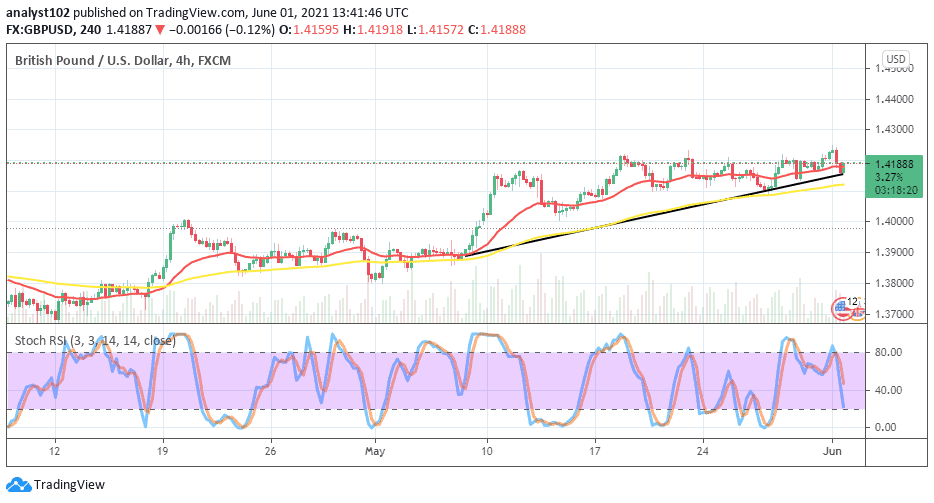
BTC/USD 4-hour Chart
After a notable downward trend in the medium-term run of the BTC/USD market operations, the crypto’s value now somewhat trades in ranges around the smaller SMA from around May 24 until the present. The 50-day SMA indicator is located over the 14-day SMA trend-line. And, the bearish trend-line drew down to touch the smaller SMA from the top to locate the current trading level of the crypto’s price. The Stochastic Oscillators have positioned between the overbought region and range 40 trying to cross the hairs toward range 80 probably to suggest the possibility of an upswing returning in no time. All in all, the market resistance level of $40,000 would have to be the most important trading zone determining the change of the market direction between Bitcoin and the US fiat currency.