
Bitcoin Price Prediction: BTC/USD Takes a Bullish Leap and Hits a Fresh 2021 High at $49,700
Bitcoin (BTC) Price Prediction – February 12
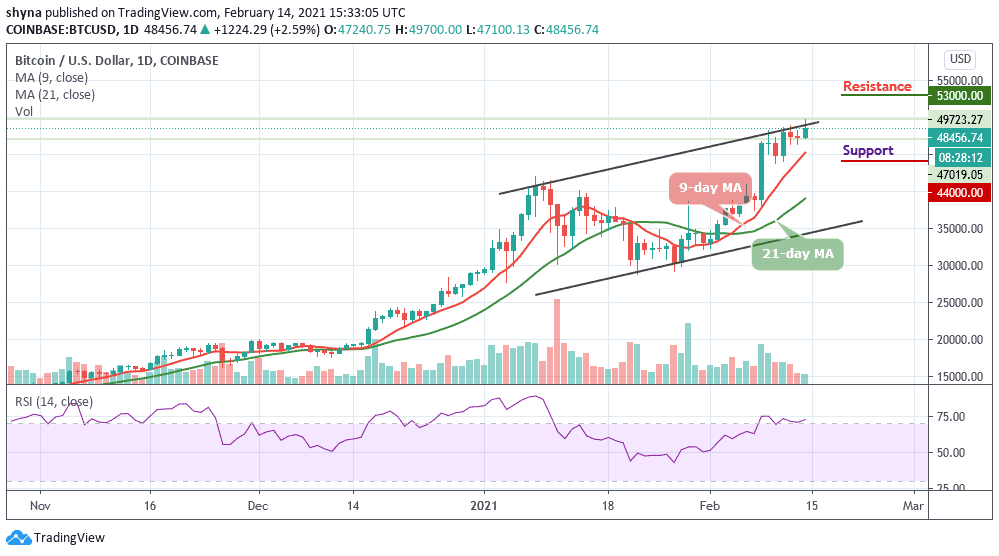
Bitcoin price approached $50,000 in a new bull-run that followed a recent dip to the support at $46,300.
BTC/USD Long-term Trend: Bullish (Daily Chart)
Key levels:
Resistance Levels: $53,000, $55,000, $57,000
Support Levels: $44,000, $42,000, $40,000
BTC/USD soars back as it joins the bull rally again after two days of relaxation. With this BTC marks a fresh high above $49,500 in the past 24 hours and it’s likely to face major resistance at $50,000. BTC/USD is likely to face strong resistance at $50,500, followed by $51,000 and it is believed to consolidate and retest support at $47,000 and $46,000.
Where is BTC Price Going Next?
Currently, the market price for BTC/USD and the daily candle is trading at $48,456 but if the bulls could successfully push the price above the channel, the next resistance levels may be found at $53,000, $55,000, and $57,000. Typically when the new uptrends are beginning to form, traders could use the 21-day moving average as the support level.
However, any failure by the bulls to move the price up, we may see a price cut to $44,800 vital support. A further low drive could send the price to $44,000, $42,000, and $40,000 supports. As the daily chart reveals, bulls are still controlling the market. But as things stand, BTC/USD price may continue to follow the upward trend because the RSI (14) is within the overbought condition.
BTC/USD Medium – Term Trend: Ranging (4H Chart)
BTC/USD trades within the range of $44,300 to $49,100. Nevertheless, Bitcoin has not yet slipped below the 9-day and 21-day moving averages as the price hovers around $48,634 and may take enough time to trade above $50,000. However, the upward movement is facing hurdles near the $52,000 and $54,000 resistance level.
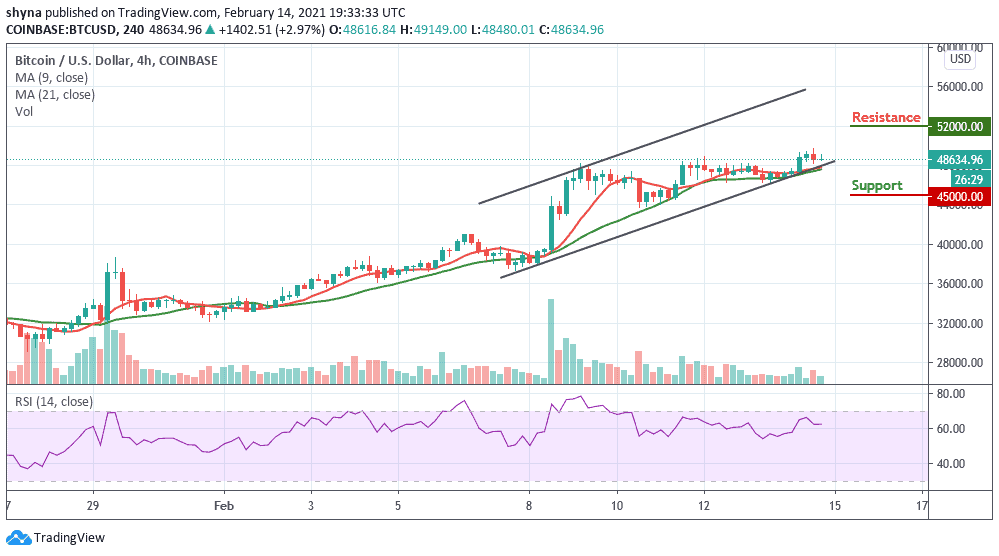
On the downside, immediate support is near the moving averages while the main support is at the $46,500 level. More so, the price might slide sharply below $46,000 which may likely test another support at $45,600 level and below. Technically, Bitcoin is currently moving in sideways as the RSI (14) moves around 62-level, indicating indecisive market movement.