
Bitcoin Price Prediction: BTC/USD Prepares to Climb $35,000
Bitcoin Price Prediction – July 7
The Bitcoin price is hovering at $34,776 after touching the daily high of $35,077 at the beginning of today.
BTC/USD Long-term Trend: Ranging (Daily Chart)
Key levels:
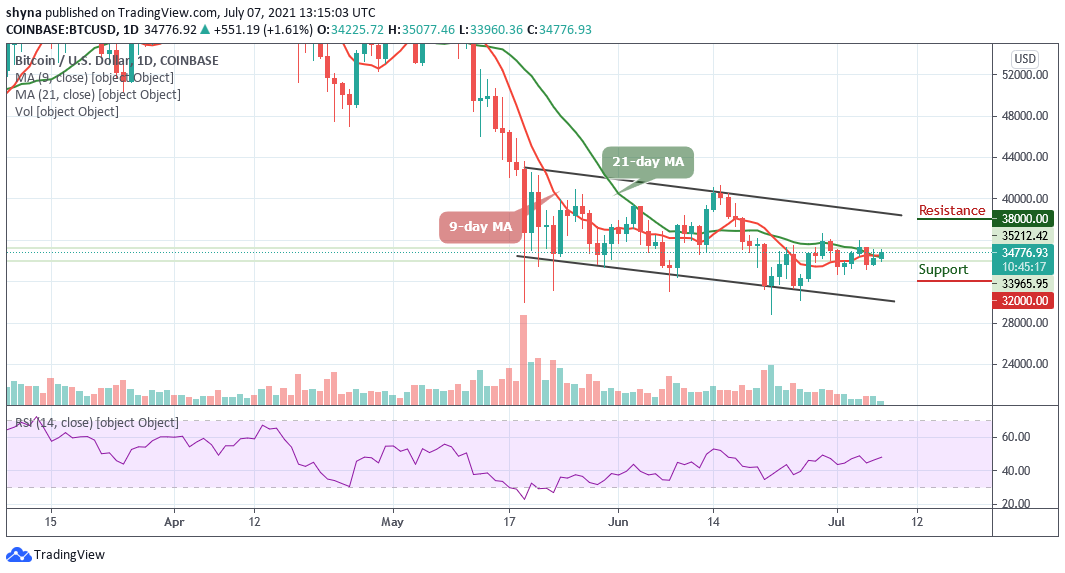
Resistance Levels: $38,000, $40,000, $42,000
Support Levels: $32,000, $30,000, $28,000
BTC/USD is currently pushing higher as the latest move marks an upwards break of the consolidation phase seen as of late, but it is important to note that it is yet to lead BTC above any key technical levels. Looking at the daily chart, the Bitcoin price has been making an attempt to maintain the bullish movement since yesterday but struggling to gain momentum at the moment.
Bitcoin Price Prediction: Bitcoin (BTC) Ready for Upwards?
The Bitcoin price is trading up marginally above its opening price of $34,225. Although the current movement marks a slight climb from where it has been trading for the past two days. However, it is important to note that this current level marks a bullish break above the 9-day and 21-day moving averages. More so, as the technical indicator Relative Strength Index (14) moves toward 50-level.
Therefore, a continuous bullish movement of the Bitcoin price could locate the potential resistance at $36,000, reaching this may also allow for an extended recovery towards $38,000, $40,000, and $42,000 respectively. Moreover, if the technical indicator RSI (14) drops below 45-level, the Bitcoin market may experience another downward movement which may force the Bitcoin price to face the lower boundary of the channel and could possibly hit the supports at $32,000, $30,000, and $28,000.
BTC/USD Medium-Term Trend: Ranging (4H Chart)
Looking at the 4-hour chart, BTC/USD needs to stay above the 9-day and 21-day moving averages in other to mitigate the short-term bullish pressure and allow for an extended recovery towards $35,000. Therefore, a higher resistance level may be found at $36,000 and above.
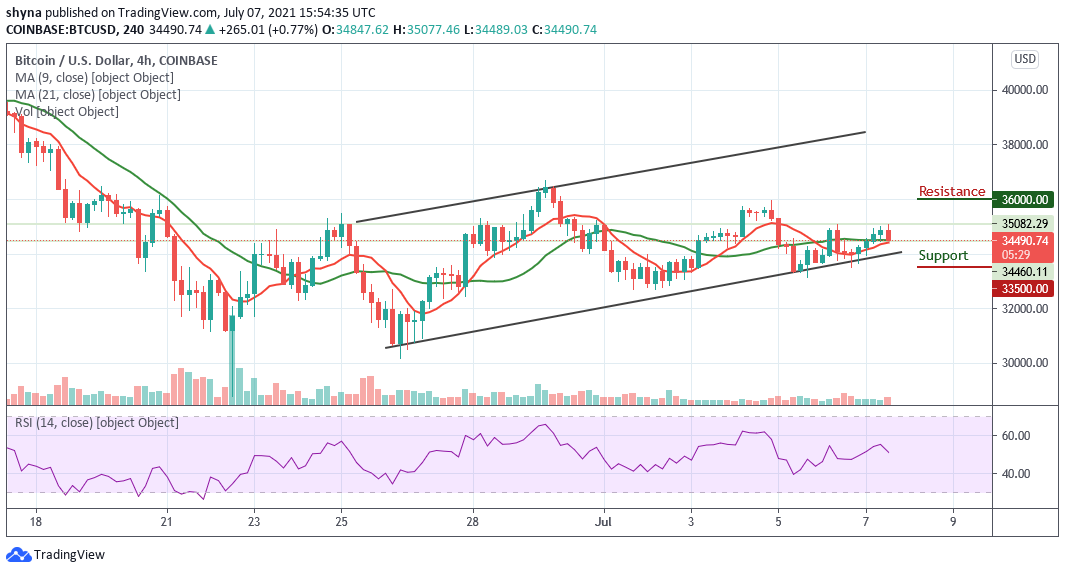
However, the Bitcoin price is seen likely to cross below the 9-day and 21-day MAs as a sustainable move below this barrier may increase the downside pressure to the support level of $33,500 and below. Meanwhile, the technical indicator Relative Strength Index (14) is facing the south, as the signal line aims to cross below 55-level which may likely increase the bearish movement.
Looking to buy or trade Bitcoin (BTC) now? Invest at eToro!
75% of retail investor accounts lose money when trading CFDs with this provider