
Bitcoin Price Prediction: BTC/USD Creeps toward $31,000
Bitcoin Price Prediction – June 25
The Bitcoin price moves below $32,000 as the king coin is likely to climb steadily with a few downward moves.
BTC/USD Long-term Trend: Ranging (Daily Chart)
Key levels:
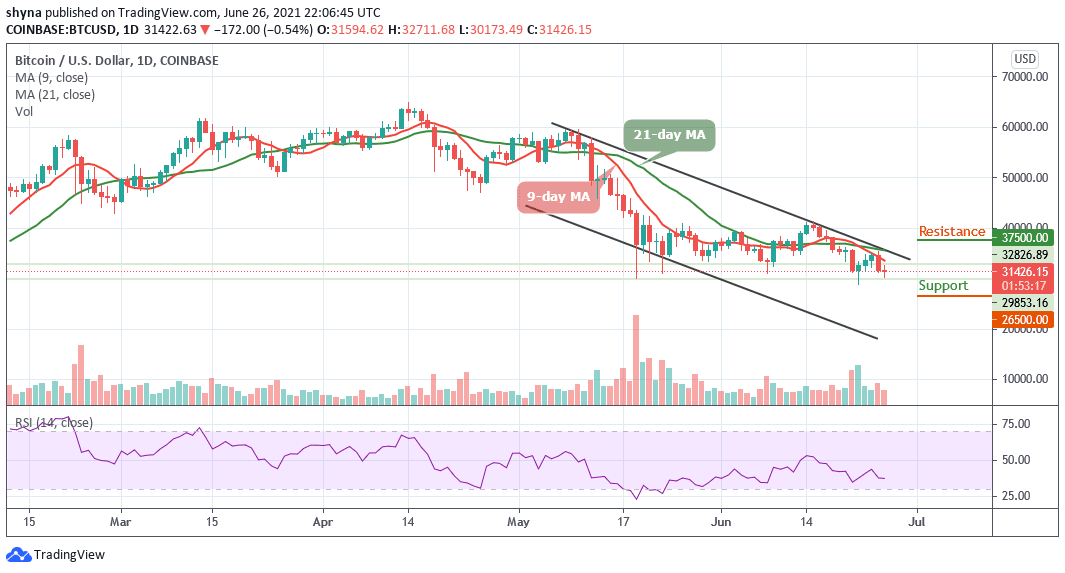
Resistance Levels: $37,500, $39,500, $41,500
Support Levels: $26,500, $24,500, $22,500
In recent days, BTC/USD has been turbulent keeping its price above the 9-day and 21-day moving averages. During the European session today, the Bitcoin price rises sharply by moving above the resistance level of $32,500. Meanwhile, the first digital asset exceeded this level before correcting lower. At the moment, the price is declining and remains below the 21-day moving average at $31,426.
Bitcoin Price Prediction: What is the Next Direction?
A crucial uptrend could form above the 9-day and 21-day MAs, with support close to $30,000 on the daily chart. However, if the decline occurs below this barrier, the price could extend its downward correction to the $28,000 level and any other loss could possibly push the Bitcoin price to the support level of $26,000.
Looking at the daily chart, the Bitcoin price touches the daily low of $30,173 and a further drop may cause the market to reach the critical supports at $26,500, $24,500, and $22,500. In other words, if the market were to rebound, traders could see the next buying pressure towards the resistance levels of $37,600, $39,500, and $41,500. Nevertheless, BTC still ranging on the daily chart, with the Relative Strength Index (14) moving sideways.
BTC/USD Medium-Term Trend: Bearish (4H Chart)
Looking at the 4-hour chart, the resistance at the $32,000 was too heavy for the bulls to overcome. So the price is seriously struggling in a consolidation mode, which has made BTC remain indecisive over the past few hours now. The resistance levels to watch are 34,000 and above.
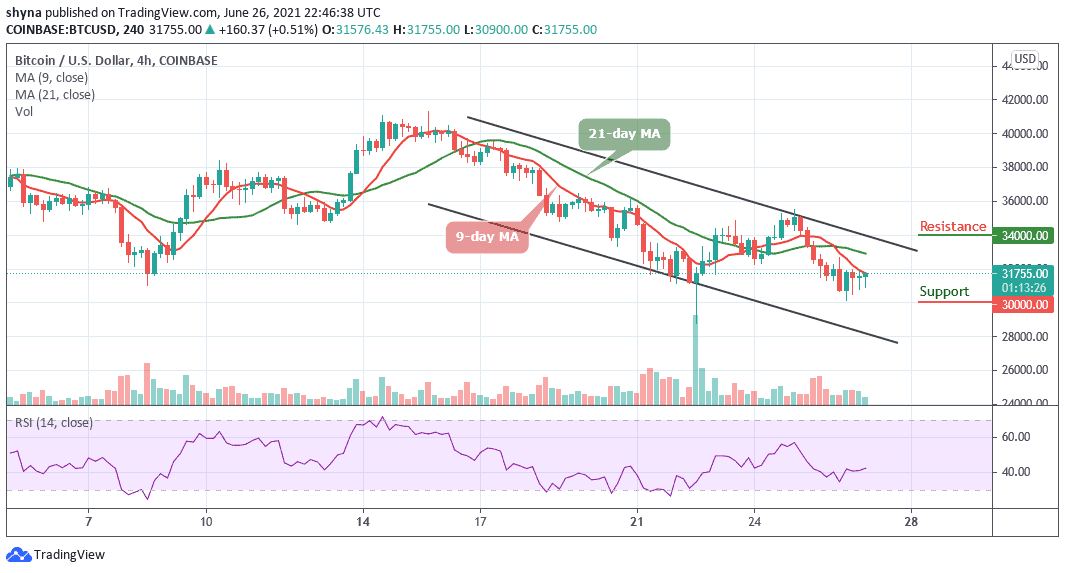
However, the Bitcoin price is still roaming around $31,755 and we can see that the bullish supply has been slowly turning heavy in the market, while the bears are trying to drag the price below $32,000 support. Meanwhile, the $30,200 and below may come into play if BTC breaks the mentioned support. The technical indicator Relative Strength Index (14) is moving to cross below the 40-level, suggesting more bearish signals.
Looking to buy or trade Bitcoin (BTC) now? Invest at eToro!
75% of retail investor accounts lose money when trading CFDs with this provider