
Bitcoin Price Prediction: BTC/USD Climbs Above $38,000 Resistance
Bitcoin Price Prediction – February 23
The Bitcoin price prediction touches the $39,000 resistance level as it is now rising, but it must stay above this level for a steady increase.
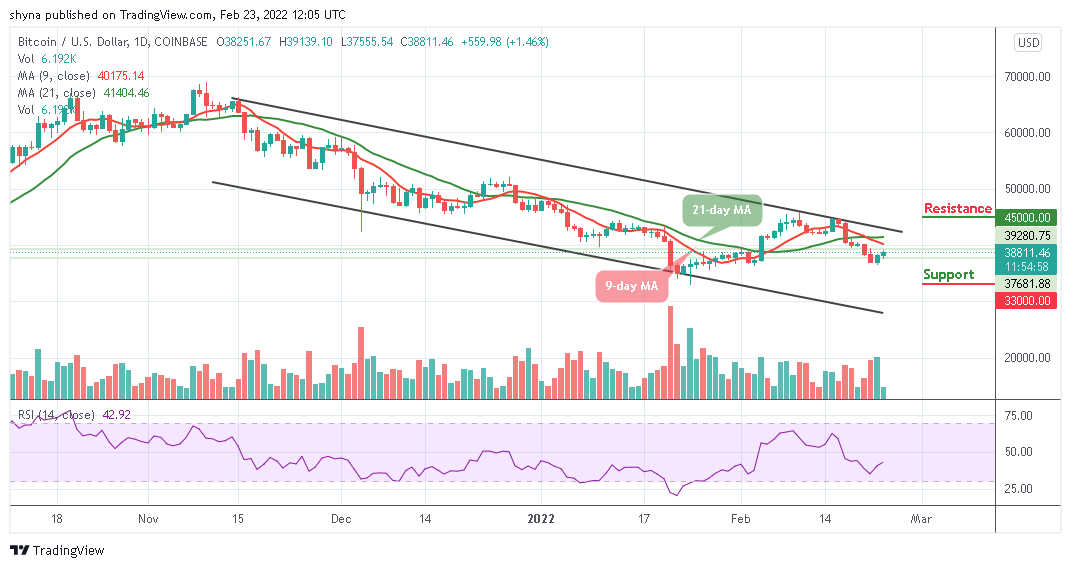
BTC/USD Long-term Trend: Bearish (Daily Chart)
Key levels:
Resistance Levels: $45,000, $47,000, $49,000
Support Levels: $33,000, $31,000, $29,000
BTC/USD is currently recovering from the $37,555 support zone as the Bitcoin price needs to cross above the 9-day and 21-day moving averages to keep the uptrend intact. The daily chart reveals that the king coin is yet to get close to the 9-day MA, and this could mean that the Bitcoin price may drop to retest the $37,000 support.
Bitcoin Price Prediction: Would Bitcoin Price Continue to Move Higher?
According to the daily chart, the Bitcoin price keeps moving closer to the upside as the coin begins a new bullish movement with a new note. In the meantime, traders could see that the Bitcoin price has continued to converge above the key level of $38,500. The Relative Strength Index (14) moves toward 50-level in an attempt to probably cross back to the north. That signals that the return of a bullish uptrend may come to play.
However, the first major resistance is near the $40,000 level, therefore, a clear break above the $42,000 level could set the pace for a larger increase to $45,000, $47,000, and $49,000 resistance levels. On the contrary, if the Bitcoin price fails to clear the $38,000 resistance, it could start a new decline as the initial support on the downside is near the $36,000 level. If there is a downside break below the $35,000 support and $34,000, the price could see a sharp decline towards the support levels of $33,000, $31,000, and $29,000 respectively.
BTC/USD Medium – Term Trend: Bearish (4H Chart)
The 4-hour chart for BTC shows that the coin is following a sideways movement as the coin crosses above the 9-day and 21-day moving averages. Any further bullish movement could hit the key resistance level at $42,000 and above.
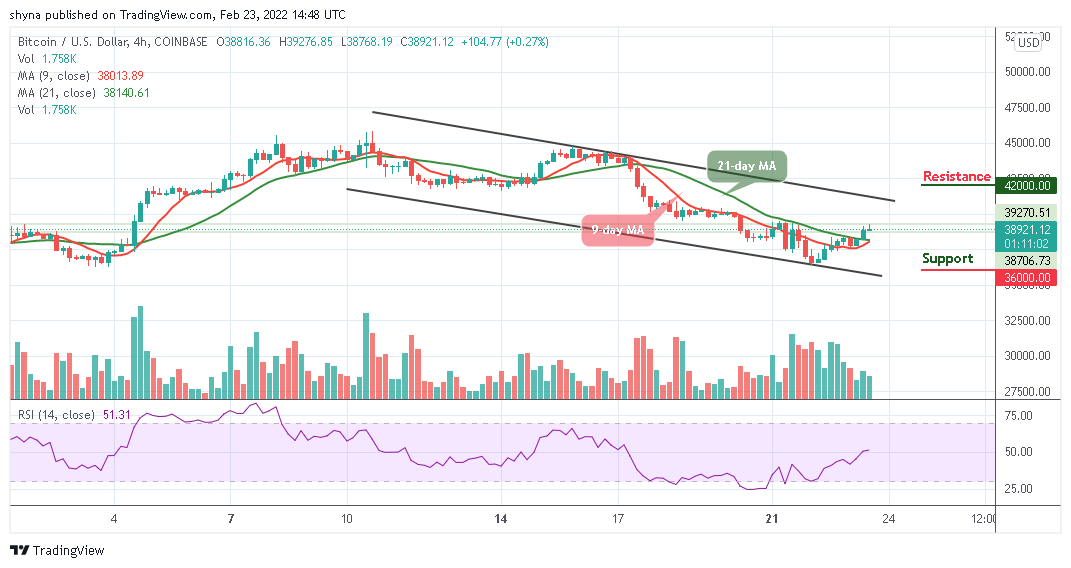
However, considering the recent sharp rebound, the Bitcoin price may move back above the $38,000 resistance. A climb above the mentioned resistance may further push the BTC price to the resistance level of $42,000 and above. As it appeared now, it seems the bulls would return to the market as the Relative Strength Index (14) moves above 50-level, suggesting bullish movement.
Looking to buy or trade Bitcoin (BTC) now? Invest at eToro!
68% of retail investor accounts lose money when trading CFDs with this provider
Read more: