
Bitcoin Price Analysis: Downtrend Continues as BTC/USD Crashes Below $46,000 Support
Bitcoin Price Analysis (BTC) – February 27
For a couple of days now, Bitcoin (BTC) has been trading below $52,000 and the next target support level could be $40,000.
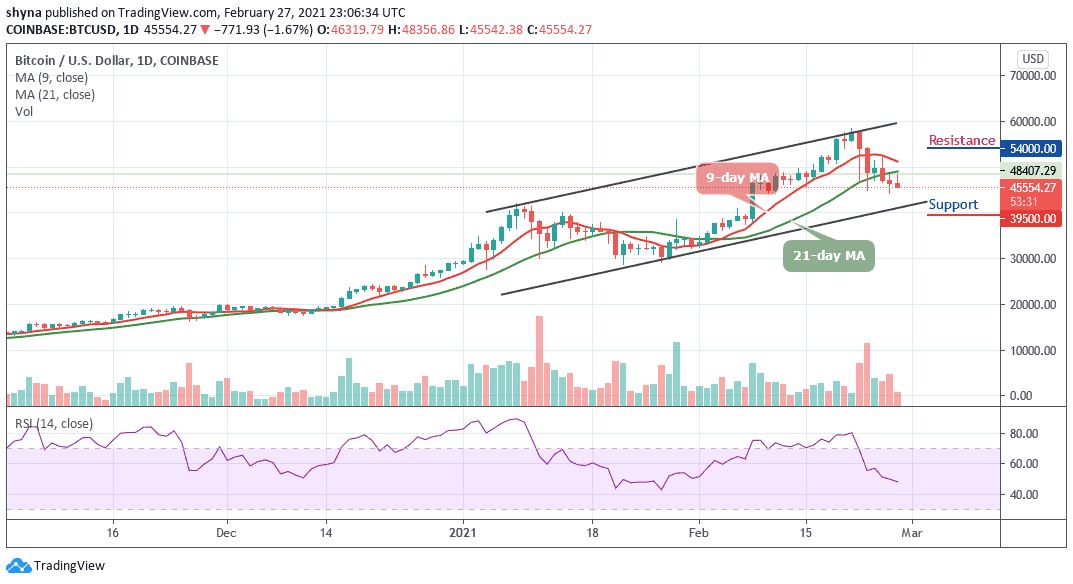
BTC/USD Long-term Trend: Bullish (Daily Chart)
Key levels:
Resistance Levels: $54,000, $56,000 $58,000
Support Levels: $39,000, $37,500, $35,500
BTC/USD crashes for the fifth time in a week trading below the $46,000 in a market-wide sell-off. The king coin remains below the 9-day and 21-day moving averages under increasing pressure from the downtrend. The coin is now losing 1.67% as the market heads toward the south while the pair is being affected by the current slowdown in the entire crypto market and has been making an attempt to recover since the past few days.
What to expect from Bitcoin (BTC)
As of now, Bitcoin is aiming to fall again as the key support of $45,000 is becoming a threat to bears. There are quite a number of technical levels clustered above the current price which means that the coin may be vulnerable to further losses at least as long as it stays below critical $45,000. BTC/USD pair may drop to $39,500, $37,500, and $35,500 supports if the $43,500 support fails to hold.
In the opposite direction, if the critical support continues to provide support for the market, definitely traders can expect the Bitcoin price to come back to a resistance level of $50,000 before the market experience a rise far above the moving averages to reach the potential resistance levels at $54,000, $56,000, and $58,000 respectively. But as it is now, the Bitcoin price is down and there is a high chance for a break than a bounce. The RSI (14) moves below 50-level, a further drop may cause the Bitcoin price to fall more.
BTC/USD Medium-term Trend: Ranging (4H Chart)
On the 4-hour chart, BTC/USD is moving inside a descending channel pattern. After falling to the $44,150 support level yesterday, the Bitcoin price later saw a quick price jump to the 9-day moving average, from where the bear resume pressure.
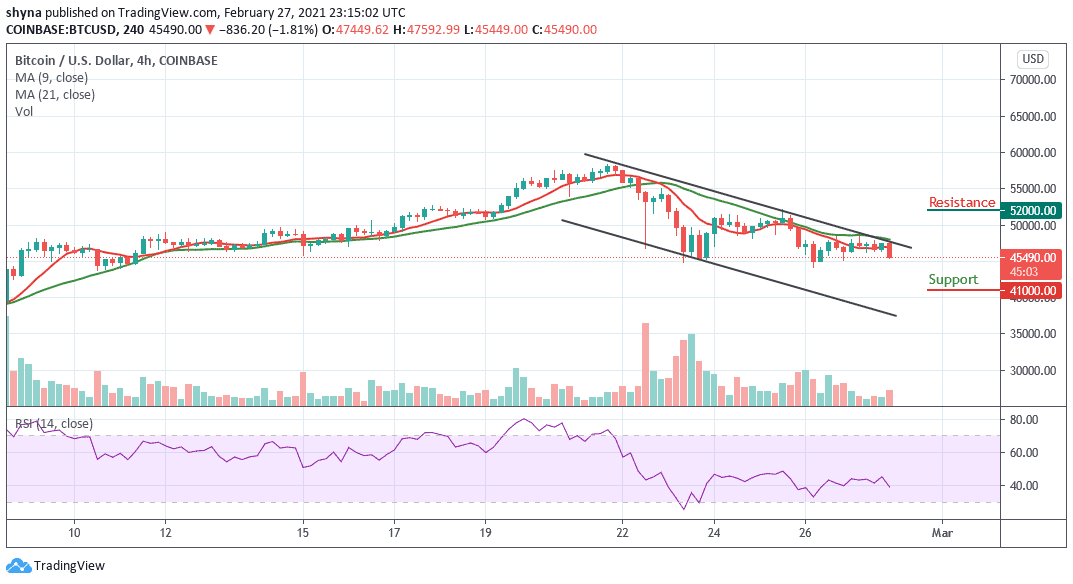
Now, the price is facing the $45,000 important support. Once this support breaks, the $41,000 and below may come into play while the resistance level is located at $52,000 and above. More so, the technical indicator RSI (14) moves below 40-level, which show more bearish momentum may likely play out.