
Bitcoin (BTC/USD) Revisits Critical Support Line
Bitcoin Price Prediction – June 26
The BTC/USD market revisits the critical support line at $30,000 while it has severally unable to push northward more after it hit a resistance around the point of $35,000 to now trade at the value of $31197. The crypto’s percentage rate stands at about -1.39 as of writing.
BTC/USD Market
Key Levels:
Resistance levels: $35,000, $40,000, $45,000
Support levels: $27,500, $25,000, $22,500
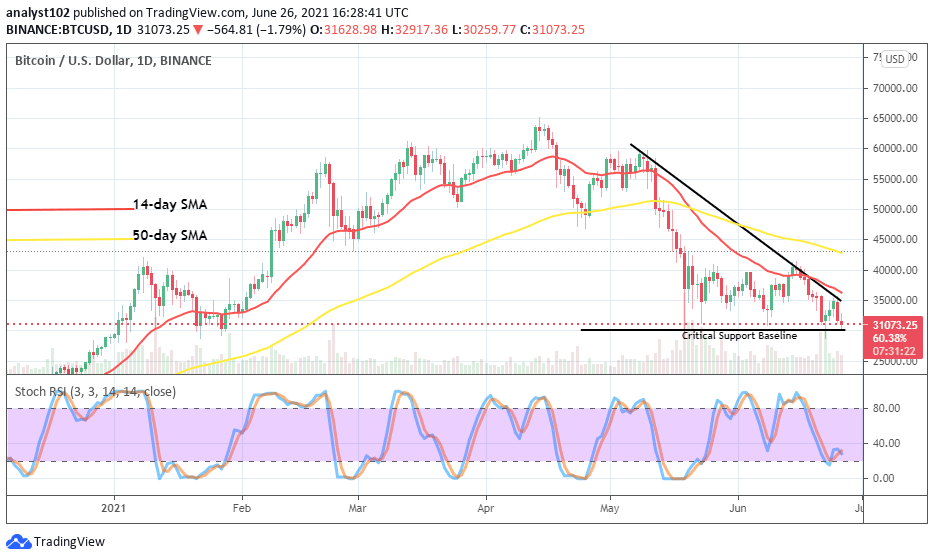
BTC/USD – Daily Chart
It is depicted on the BTC/USD daily chart that the crypto economy now revisits the critical support line at $30,000. Yesterday’s session witnessed a full-fledged formation of bearish candlestick between the points of $35,000 and very closely to $30,000. That has led the market to briefly trade around the lower value during today’s trading operation. Both the bearish and the 14-day SMA trend lines drew nearly above the point of $35,000 underneath the 50-day SMA indicator. The Stochastic Oscillators are in the ranges of 20 and 40 with closed lines in an attempt pointing to the southbound to suggest that a downward force is yet to be exhausted in the trading activity involving Bitcoin and the US Dollar.
Could it tough for the BTC/USD market to end dumping as it revisits the critical support line?
It could tough for the BTC/USD market to end dumping as price revisits a critical support line of $30,000 in the near time. The degree of a signal attempt currently made by the Stochastic Oscillators poses a warning against probably seeing a reliable bounce-off from the critical support trading zone of the market. However, a decent bearish reversal move below the critical support line cannot as well put aside to make a buy order while it surfaces.
Bearish trend continuation of this market could be while the market keeps firmly around the critical support-line as yesterday’s session. If that assumption eventually plays out accordingly, the lower support line of around the level of $25,000 will be in focus. Bears have to be cautious of late exertion of entry not to get whipsawed at any time.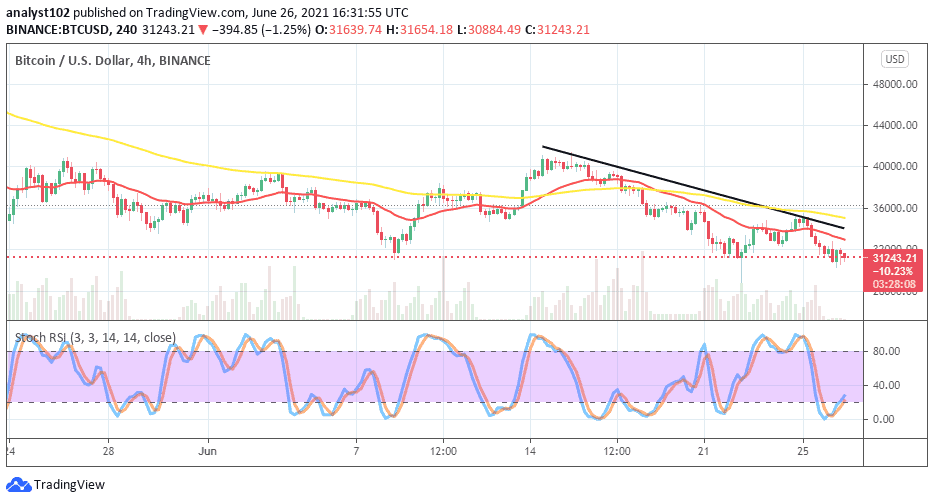
BTC/USD 4-hour Chart
The BTC/USD medium-term chart also has it that price revisits critical support-line around $32,000 level. And, it appears that that point has been the vital spot that bulls have been reliably making a rebuilt effort to make a rebound while notable fall-offs showcase in the market. The 50-day SMA indicator is located over the 14-day SMA trend-line as the bearish trend-line drew between them. The Stochastic Oscillators have crossed from the oversold region to point toward the northbound slightly over range 20. That signifies that a degree of upswings is somewhat in the cards.
Looking to buy or trade Bitcoin (BTC) now? Invest at eToro!
75% of retail investor accounts lose money when trading CFDs with this provide