
Bitcoin Price Prediction: BTC/USD Stabilizes Above $43,000; Can It Go Higher?
Bitcoin Price Prediction – January 15
The Bitcoin price prediction shows that BTC is trading at $43,443 but the coin seems to be preparing for another upward movement.
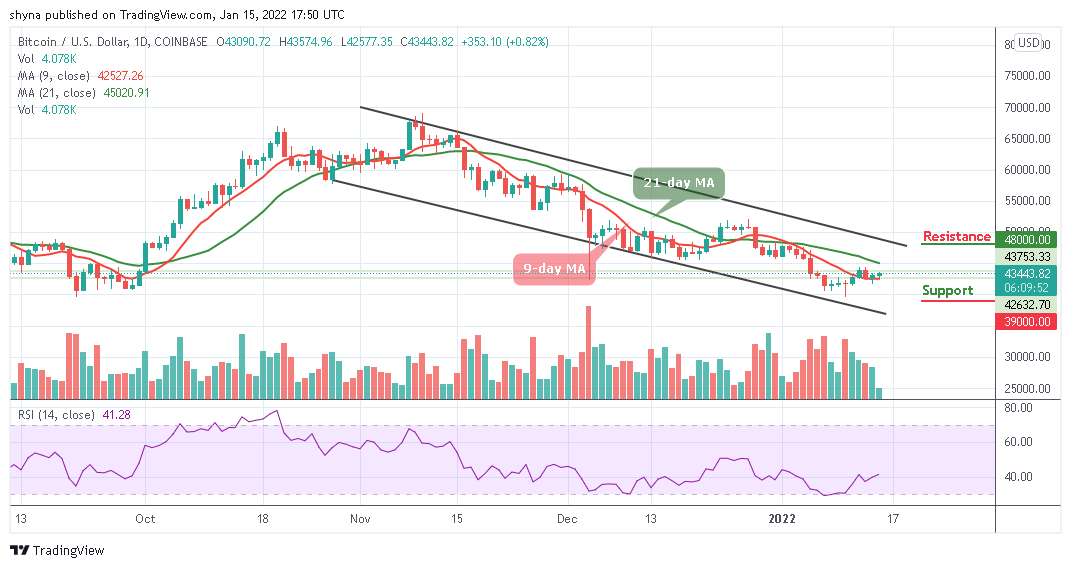
BTC/USD Long-term Trend: Bearish (Daily Chart)
Key levels:
Resistance Levels: $48,000, $50,000, $52,000
Support Levels: $39,000, $37,000, $35,000
BTC/USD is currently trading above the 9-day moving average at $43,443 as this coin prepares to head towards the 21-day moving average. Today, the largest digital asset is likely to extend towards the resistance level of $45,000 after touching the daily low of $42,577.
Bitcoin Price Prediction: Is $45k Resistance Coming for BTC?
As of now, the Bitcoin price is trading above the 9-day moving average as the next resistance levels could be located at $48,000, $50,000, and $52,000. Typically, when the new uptrends are coming to play, traders could use the 21-day moving average as a pivot resistance point to gauge the strength of the trend. However, if BTC/USD keep soaring towards the upper boundary of the channel, this could be a sign of sustainability and may likely result in a bullish continuation.
Nevertheless, should BTC price failed to move up; traders may see a price cut below the 9-day moving average and a further low could bring the price to the support levels of $39,000, $37,000, and $35,000 respectively. Now, the bulls are still defending the key support at $42,000. But as it stands, the Bitcoin price is rising as the technical indicator Relative Strength Index (14) is crossing above 40-level.
BTC/USD Medium-Term Trend: Ranging (4H Chart)
Looking at the 4-hour chart, the market has been following a sideways movement for the past few days, but the bulls are now trying to dominate the market by defending the $43,000 level. If not, the support level of $42,000 and below may come into play.
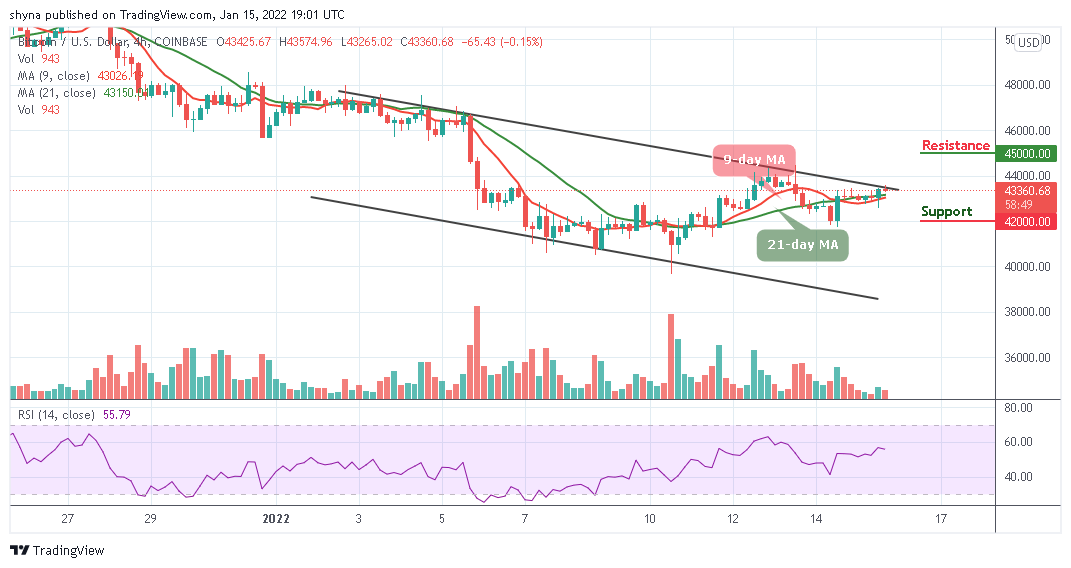
However, if the bulls keep the market above the 9-day and 21-daymoving averages, traders may expect a retest at the $44,000 resistance level, and breaking this level may further push the price towards the resistance level of $45,000 and above. Nevertheless, the technical indicator Relative Strength Index (14) is seen moving below 60-level, suggesting sideways movement within the market.
Looking to buy or trade Bitcoin (BTC) now? Invest at eToro!
68% of retail investor accounts lose money when trading CFDs with this provider
Read more: