
Bitcoin Price Prediction: BTC/USD Moves Around $43,000
Bitcoin Price Prediction – January 15
The Bitcoin price prediction shows that BTC keeps moving within the moving averages as the coin ready for the next direction.
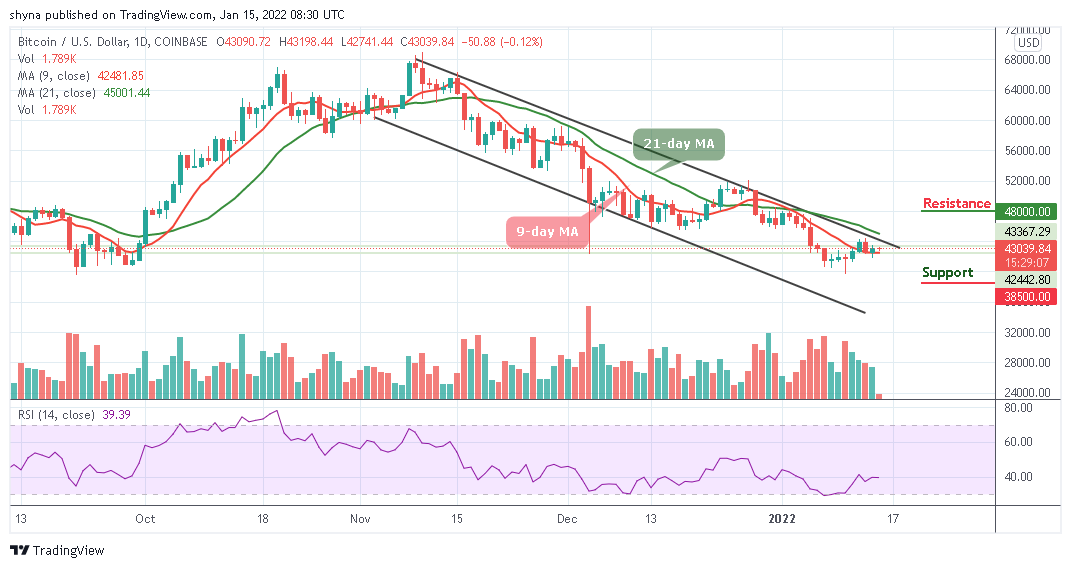
BTC/USD Long-term Trend: Bearish (Daily Chart)
Key levels:
Resistance Levels: $48,000, $50,000, $52,000
Support Levels: $38,500, $40,500, $42,500
BTC/USD is currently struggling to maintain its position above $43,000 and its price could see a dive below the 9-day moving average. The Bitcoin price is currently in a dangerous position as the price may slip below the nearest support level of $42,000. If the breakdown come to play, then, the downside momentum may gain traction with the next focus at the support level of $40,000.
Bitcoin Price Prediction: Bitcoin (BTC) May Gain More Downsides
If the Bitcoin price rejects the higher resistance level, lower levels may likely come to play until prices touch the next critical support level. However, the number one crypto may experience a lot of short-term based trades and a lot of volatility too as the technical indicator Relative Strength Index (14) keeps moving around 40-level.
Nevertheless, the traders need to note that the Bitcoin price may continue to focus at the downside for as much as the 9-day MA remains below the 21-day MA, and its failure to hold the current support level may pull the price down to $40,000 level. Therefore, the short-term analysis indicates that BTC/USD may test lower level with key support at $41,500 before a rebound and the support levels to watch are $38,500, $36,500, and $34,400 while the resistance levels are located at $48,000, $50,000, and $52,000 respectively.
BTC/USD Medium – Term Trend: Ranging (4H Chart)
According to the 4-hour chart, BTC/USD has been moving sideways throughout the past several days, with sellers dominating the market. However, if bulls decide to push the market price above the upper boundary of the channel, the coin may likely locate the resistance level of $44,500 and above.
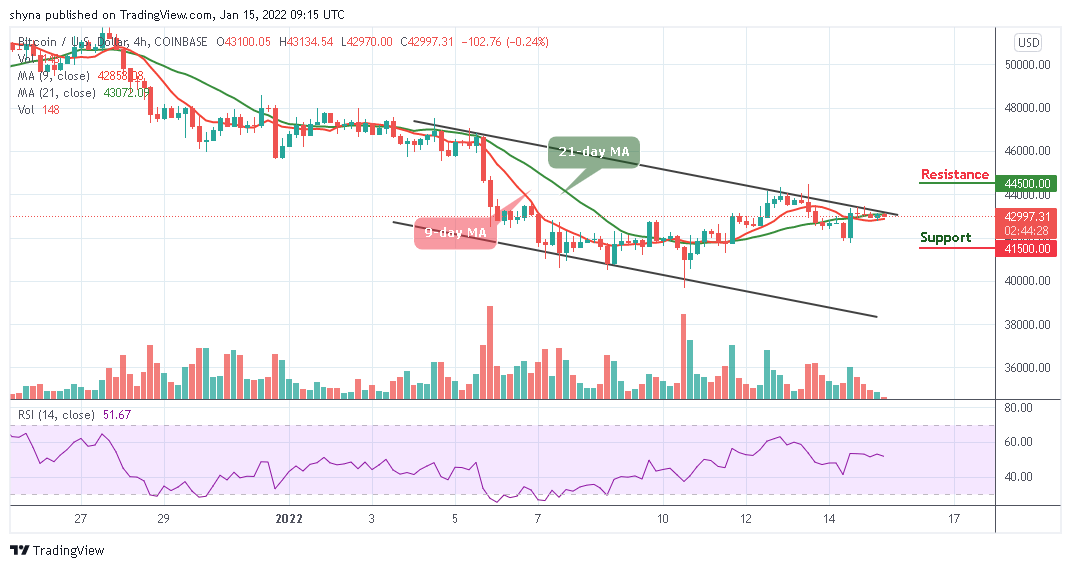
Meanwhile, it now appears that the cryptocurrency is not yet ready for the upside until the 9-day MA crosses above the 21-day MA, the multiple attempts to shatter its $43,000 resistance seems to indicate that bears are building momentum. Moreover, as the technical indicator Relative Strength Index (14) moves towards the east, any further bearish movement may locate the critical support at $41,500 and below.
Looking to buy or trade Bitcoin (BTC) now? Invest at eToro!
68% of retail investor accounts lose money when trading CFDs with this provider
Read more: