
Ethereum (ETH) Price: Shows Recovery Potential as 1.09M ETH Leaves Centralized Platforms
TLDR
Over 1.09 million ETH ($2.9 billion worth) has moved off centralized exchanges in the past nine days, indicating reduced selling pressure and potential bullish momentum
ETH/BTC’s monthly Relative Strength Index hit oversold levels for the first time in Ethereum’s history, suggesting a possible trend reversal
The 365-day MVRV ratio dropped to -17.48%, similar to levels seen before an 88% rally in late 2024
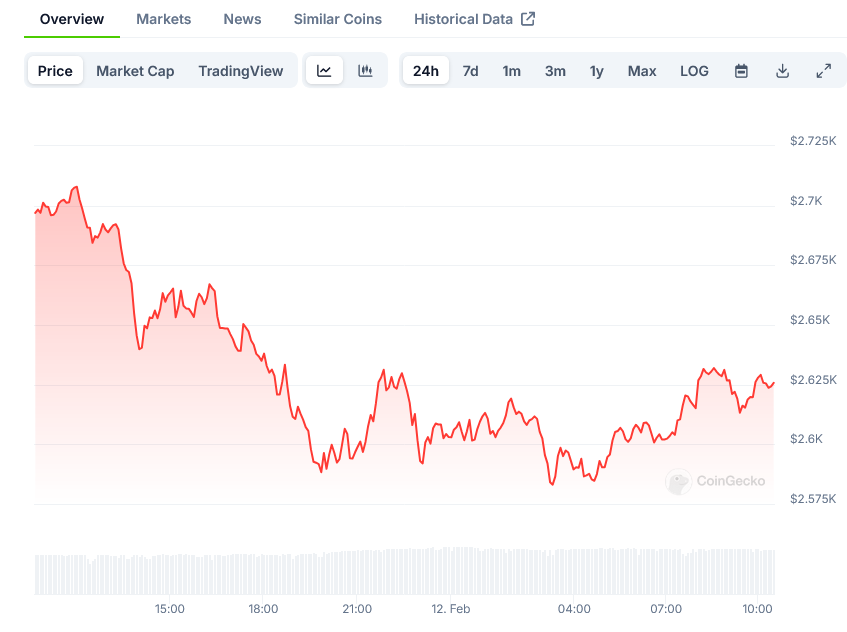
Ethereum is currently trading around $2,700, up 7% over two days, with key resistance levels at $2,800 and $3,306
Technical indicators show consolidation above $2,500 support level with potential for upward movement if price breaks above $2,700
A major shift in Ethereum’s market dynamics is underway as data reveals more than 1.09 million ETH, valued at approximately $2.9 billion, has moved off centralized exchanges over the past nine days. This substantial reduction in exchange supply comes as Ethereum’s price shows early signs of recovery, trading around $2,700.
The massive outflow from exchanges, tracked by analytics firm Santiment, represents a notable decrease in potential selling pressure. When cryptocurrencies leave exchanges, it typically indicates holders are moving their assets to private wallets for longer-term storage rather than keeping them ready for immediate trading or selling.
This movement coincides with Ethereum’s price finding support around the $2,500 level after a period of downward pressure. The second-largest cryptocurrency by market cap has responded with a 7% increase over the past 48 hours, suggesting the market may be starting to react positively to the reduced supply on exchanges.
Ethereum Price on CoinGecko
Technical indicators are adding weight to the potential recovery narrative. The ETH/BTC pair’s monthly Relative Strength Index (RSI) has reached oversold territory for the first time in Ethereum’s history. This unusual development comes after Bitcoin’s strong performance above $100,000 contrasted with Ethereum’s more modest price action throughout 2024 and early 2025.
The current ETH/BTC ratio stands at 0.02, a level that historically has not sustained for extended periods. Market analysts suggest this extreme reading could indicate an imminent shift in market sentiment, potentially leading to a period of outperformance for Ethereum relative to Bitcoin.
Further supporting the possibility of a trend reversal, the 365-day Market Value to Realized Value (MVRV) ratio has entered what analysts call the “opportunity zone.” This metric, which measures the average profit or loss of investors who purchased ETH in the past year, recently touched -17.48%.
Historical data shows the last time the 365-day MVRV dropped below -13.80% was in September 2024, preceding an 88% price rally over the following four months that took Ethereum to $4,000. While past performance doesn’t guarantee future results, this parallel has caught the attention of market participants.
Techincal Analysis
On the technical analysis front, Ethereum’s price structure shows several key levels to watch. The immediate resistance lies at $2,683, marked by the previous month’s Volume Weighted Average Price (VWAP). Beyond that, the weekly VWAP at $3,306 represents another crucial hurdle.
The formation of a bearish trend line on the hourly chart at $2,690 presents a near-term challenge. However, analysts suggest that a decisive break above $2,700 could open the path toward higher price targets.
Short-term support has emerged around $2,550, with additional backing at $2,520. These levels have helped establish a base for the recent price action, providing a foundation for potential upward movements.
The hourly charts show the MACD indicator losing bearish momentum, while the RSI remains below the 50 mark, suggesting the market is still finding its footing after recent declines.
Looking at the broader picture, Ethereum’s price had previously tested the 50% Fibonacci retracement level of the upward wave from $2,125 to $2,922, finding buyers near the $2,500 zone.
Exchange data continues to show reduced selling pressure, with the trend of ETH leaving centralized platforms maintaining its pace. This ongoing exodus of tokens from exchanges suggests a shift in holder behavior toward longer-term positioning.
Recent price action shows consolidation above the $2,500 support level, with steady buying pressure emerging at these prices. Trading volume patterns indicate accumulation by larger holders during this period of price stability.
The market structure currently displays a series of higher lows on lower timeframes, suggesting buyers are becoming more active at successively higher price points.
Technical resistance remains at the $2,800 and $2,820 levels, with the $2,920 mark representing a key barrier for any sustained upward movement. A break above these levels could trigger increased buying activity.
The latest data shows continued outflows from exchanges, with the total amount of ETH held on centralized platforms reaching its lowest level in recent months.
The post Ethereum (ETH) Price: Shows Recovery Potential as 1.09M ETH Leaves Centralized Platforms appeared first on Blockonomi.


