
Bitcoin Price Prediction for Today, July 25: BTC Trades Below $22,000 as Bears Show-up
The Bitcoin price prediction shows that BTC is currently down by 3.78% after terribly crossing into the negative side.
Bitcoin Prediction Statistics Data:
- Bitcoin price now – $21,728
- Bitcoin market cap – $422.2 billion
- Bitcoin circulating supply – 19.1 million
- Bitcoin total supply – 19.1 million
- Bitcoin Coinmarketcap ranking – #1
BTC/USD Long-term Trend: Bearish (Daily Chart)
Key levels:
Resistance Levels: $30,000, $32,000, $34,000
Support Levels: $15,000, $13,000, $11,000
The daily chart reveals that BTC/USD is trading below the $22,000 level. As the Bitcoin price fails to stay above this level, the coin may likely see another sharp drop below the support level of $21,500. However, the red line of the 9-day MA is likely to cross below the green line of the 21-day MA as the Relative Strength Index (14) moves to cross below 50-level.
Bitcoin Price Prediction: Bitcoin (BTC) May Fall More
The daily chart reveals that the Bitcoin price refuses to move to the positive side as the coin gets ready for another decline below the $21,500 level. However, the first support level could be located at around $21,000. Beneath this, other support lies at $15,000, $13,000, and $11,000 levels. Meanwhile, a break above the previous level of $22,665 could set Bitcoin up to retest the $23,000 level.
Now, the Bitcoin price is likely to cross below the 21-day moving average, which could become new support. Furthermore, traders can see that the Bitcoin price is ready to drop more. More so, if the coin moves toward the upside, the king coin could locate the potential resistance levels at $30,000, $32,000, and $34,000.
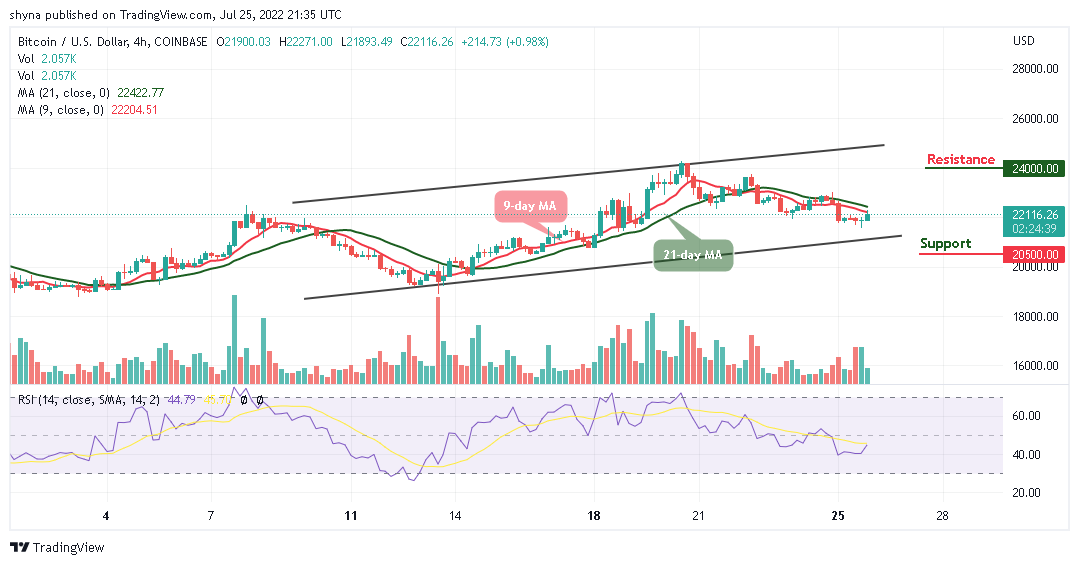
BTC/USD Medium-Term Trend: Ranging (4H Chart)
The 4-hour chart shows that the Bitcoin bulls are likely to step back into the market pushing the BTC price above the resistance level of $23,000. Although the Bitcoin price has not yet crossed above $22,500, it’s still in the loop of making a bounce back.
Looking at the chart, the Bitcoin price is likely to cross above the 9-day and 21-day moving averages as the possible upward movement may push the price to the nearest resistance level of $24,000 and above. On the other hand, any further bearish movement below the lower boundary of the channel may locate support at $20,500 and below. The technical indicator Relative Strength Index (14) is moving towards the 50-level, suggesting bullish movement.
Battle Infinity – New Crypto Presale
- Presale Until October 2022 – 16500 BNB Hard Cap
- First Fantasy Sports Metaverse Game
- Play to Earn Utility – IBAT Token
- Powered By Unreal Engine
- CoinSniper Verified, Solid Proof Audited
- Roadmap & Whitepaper at battleinfinity.io
Read more: