
Bitcoin Price Prediction for Today, August 16: BTC Losses at $25,000
Bitcoin Price Prediction – August 16
Bitcoin losses at $25,000 against the US Dollars’ worth after a tinier push to the upside as it witnessed a low of $22,771.52 and a high of $25,135.59 in the last seven days. As of the time of writing, price trades at $24,108.26 at a minute positive percentage rate of 0.05.
Bitcoin (BTC) Statistics:
BTC price now – $24,108.26
BTC market cap – $459.4 billion
BTC circulating supply – 19.1 million
BTC total supply – 19.1 million
Coinmarketcap ranking – #1
BTC/USD Market
Key Levels:
Resistance levels: $25,000, $27,500, $30,000
Support levels: $20,000, $17,500, $15,000
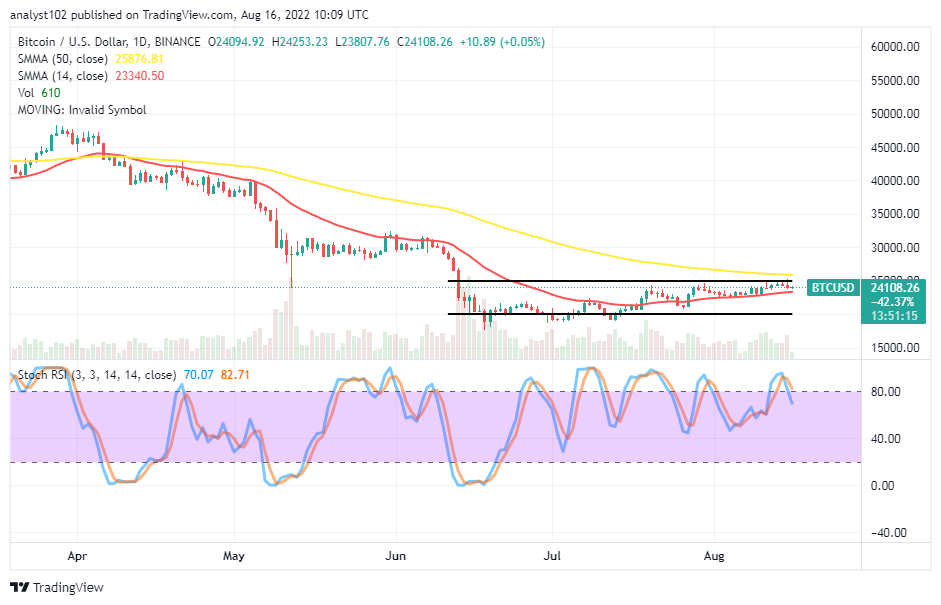
BTC/USD – Daily Chart
The daily chart reveals the BTC/USD price losses at $25,000 after briefly pushing past it during a near-trading session. There has not been much difference in the trading outlook of the crypto economy as the upper horizontal line relevantly remains drawn at the value line, and the lower horizontal line drew at the $20,000 to portray the market yet features in range-trading zones. The 14-day SMA is underneath the 50-day SMA. The Stochastic Oscillators have slightly crossed southbound from the overbought region to position at 82.71 and 70.07 range points. And they are still somewhat pointing in the south direction.
Your capital is at risk.
Which direction of the BTC/USD trade has a higher probability of pushing through as of the present?
As it has been that Bitcoin loses at $25,000 resistance to the US currency after failing to sustainably surge past it may now give a chance to the market bears, having a higher probability of pushing through some supports below the value line. At the moment, buying activity may need to suspend for a while. A fearful downward push has to be against the trend line of the 14-day SMA at $23,340.50 to find support for an upward-reversal motion before long-position placers can have a decent re-launch of a buying order afterward.
On the downside of the technical analysis, sellers may now start coming back into the by placing their risk target a bit above the $25,000 resistance level immediately they might have launched a sell order. They should be wary of late execution of entry orders while intending to follow an active motion to the downside whenever it tends to play out at any point.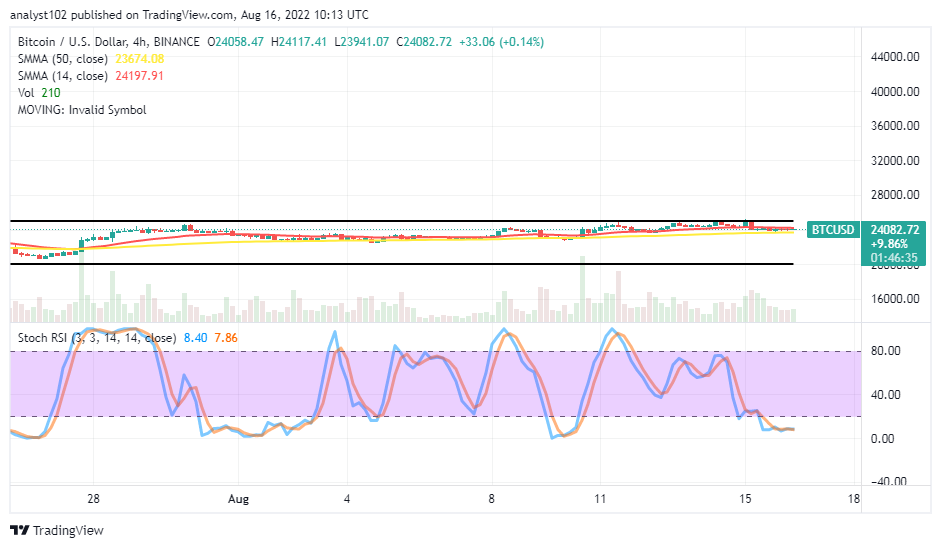
BTC/USD 4-hour Chart
The BTC/USD medium-term chart showcases the trading instrument losses at $25,000 at an upper range spot after a slight upward push not sustained by the market bulls. The 14-day SMA indicator is closely above the 50-day SMA indicator within the range value lines. The Stochastic Oscillators have moved southbound into the oversold region, indicating a consolidation-moving mode. That suggests a downward-trending motion might play out for a while if the moving status doesn’t prolong.
Tamadoge – Play to Earn Meme Coin

- Earn TAMA in Battles With Doge Pets
- Capped Supply of 2 Bn, Token Burn
- NFT-Based Metaverse Game
- Presale Live Now – tamadoge.io
Read more: