Bitcoin Price Prediction: BTC/USD value hits the $60,000 resistance again to hover

Bitcoin Price Prediction – April 4
Over time, there has been a persistent occurrence of the BTC/USD valuation being featuring around the key resistance level of $60,000. That shows how vital the high value of the main trading line is.
BTC/USD Market
Key Levels:
Resistance levels: $65,000, $70,000, $75,000,
Support levels: $50,000, $45,000, $40,000
BTC/USD – Daily Chart
It is still obvious that the BTC/USD trading chart uphold bullish-trend bias as some indicators point towards the north direction. Meanwhile, the emergence of candlesticks representing price movements is formed close to the smaller SMA trend-line more purposefully to find support while tending for a short pull-down. The bullish trend-line and the 14-day SMA are situated over the 50-day SMA trading indicator. The Stochastic oscillators are into the overbought region. They have crossed the hairs closely over range 80. There seems that the BTC/USD market now experiences a consolidation move.
Is there a strong expectation that the BTC/USD will now push past the $60,000 resistance?
As been the usual technical trading approach of most times, the current energy possessed by the BTC/USD bulls appeared devoid of active pushing efforts needed to push past the key resistance in the near time. The resistance area of $60,000 value may have to be in focus as a fake breakout could occur while less active price action tends to resurface at that point. In other words, traders need to be cautious of placing further buying entry to avoid being getting trapped.
On the downside, the bears appear to have built up a tough line around the main resistance level of $60,000 as buying pressures have been mostly relaxing efforts around it. Nevertheless, there is a need that visible selling pressure has to be in play before considering a sell-order of this crypto-trade around the key price resisting area. 
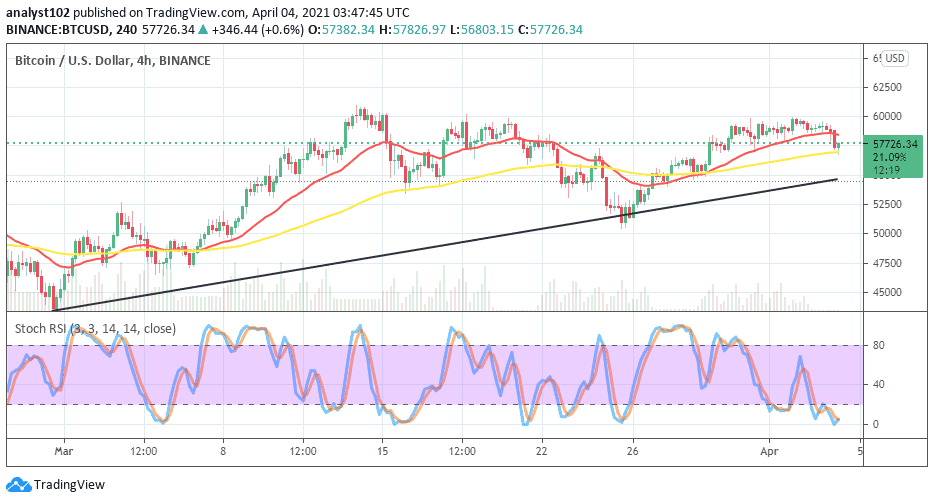
BTC/USD 4-hour Chart
It is yet depicted by the trading chart that the BTC/USD market operation runs in a bullish outlook until the present of writing. The 14-day SMA trend-line is located over the 50-day SMA with a small space separating them at a high point. And the bullish trend-line is long drawn below the two SMAs pointing to the northbound. The Stochastic Oscillators are now dipped into the oversold region to signify the possibility of seeing the bulls beefing up soon. Going by the present trading formation, it will ideally technical that bulls find back their stance around support trading area of $56,000 or thereabout.


