Bitcoin Price Prediction: BTC/USD Swings Above $35,000; Bullish Confirmation?
Bitcoin (BTC) Price Prediction – February 2
The price of Bitcoin restarts the uptrend after crossing above the critical barrier of $34,000 to touch the daily high of $36,000.
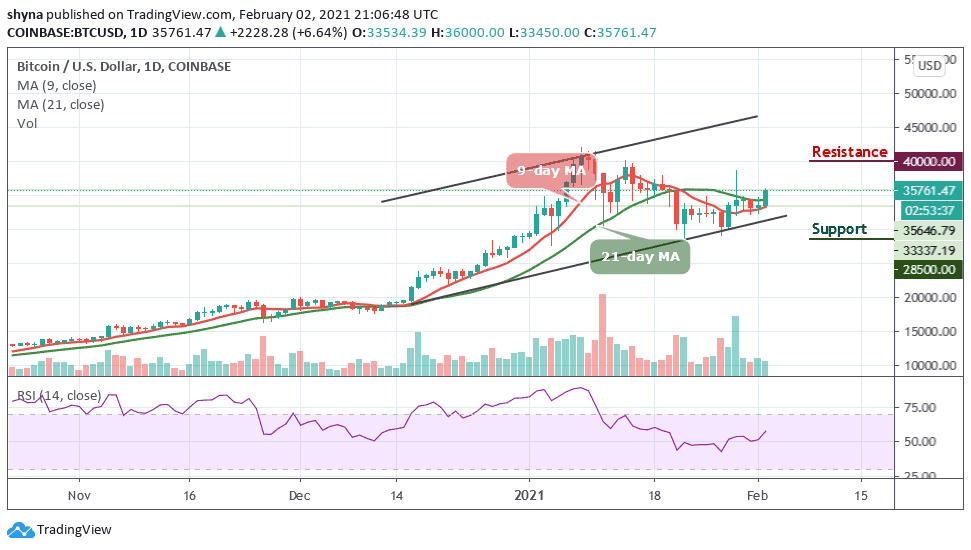
BTC/USD Long-term Trend: Ranging (Daily Chart)
Key levels:
Resistance Levels: $40,000, $42,000, $44,000
Support Levels: $28,500, $26,500, $24,500
After a small correction, BTC/USD looks green trading above the resistance level of $35,000 from the low of $33,450. However, a daily close above the $35,000 may continue to boost the king coin towards $40,000. At the moment, all eyes are focusing on the next hurdle at $38,000. However, traders should note that a consistent price rise would encourage more investors to join the market as buyers increase their positions. Therefore, if enough tailwinds are created behind BTC, a final leg to $40,000 may likely materialize.
What is the Next for Bitcoin?
The strength in BTC’s high time frame market structure seems to indicate that a move up towards $37,000 could be imminent in the near-term. At the time of writing, BTC/USD is trading up at its current price of $35,761 which marks a notable rise from recent lows of $33,450 that were set and visited in the early hours of today.
Nevertheless, if the market decides to fall below the moving averages, Bitcoin price could fall below the lower boundary of the channel at $30,000, and if that support fails to hold the sell-off, traders could see a further decline towards the support levels of $28,500, $26,500, and critically $24,500. All the same, any further bullish movement above the moving averages may hit the resistances at $40,000, $42,000, and $44,000 as the RSI (14) moves above 55-level.
BTC/USD Medium – Term Trend: Ranging (4H Chart)
Looking at the 4-hour chart, BTC/USD is trading above the 9-day and 21-day moving averages. However, intraday trading is still looking bullish but a cross below the channel could hit the support levels at $33,800 and above.
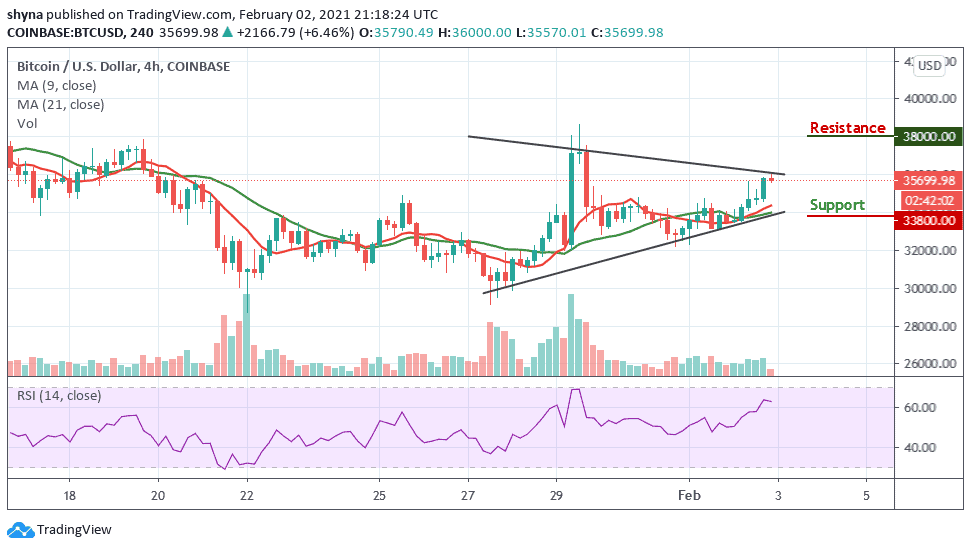
However, in as much as buyers keep moving the market upward, traders can expect a retest at the $36,500 resistance level, and breaking this level may further push the price towards the resistance level of $38,000 and above. Similarly, the RSI (14) moves above 60-level to confirm the bullish movement.