Bitcoin Price Prediction: BTC/USD Spikes to $34,000

Bitcoin Price Prediction – July 24
The Bitcoin (BTC) is ready for a major bounce as the coin moves above the $34,000 level to reclaim the upside.
BTC/USD Long-term Trend: Bearish (Daily Chart)
Key levels:
Resistance Levels: $38,000, $40,000, $42,000
Support Levels: $31,000, $29,000, $27,000
BTC/USD is now facing the upside and according to the daily chart; it seems that there is nothing holding it back from reaching the higher level. After a tumultuous week of trading, the coin has just painted a new high for the week as it is currently trading at $34,458. The Bitcoin price spiked above $34,500 as the market remains above the 9-day and 21-day moving averages.
Bitcoin Price Prediction: BTC Price May Surge to $35,000 Level
The Bitcoin price is currently trading towards the upper boundary of the channel as the king coin establishes an additional bullish signal. With the look of things, the current market movement now favors the bulls, giving the daily close produced a large bullish engulfing candle with eyes now set on the daily resistances at $38,000, $40,000, and $42,000 respectively.
On the contrary, any bullish rejection at the current level may likely lead to declines to the critical support below the 9-day and 21-day moving averages. Moreover, should in case the Bitcoin price drops and touches the low of $32,000 support, then the coin may rely on the long-term support levels at $31,000, $29,000, and $27,000. Moreover, the technical indicator Relative Strength Index (14) now moves to cross above the 60-level, suggesting more bullish signals.
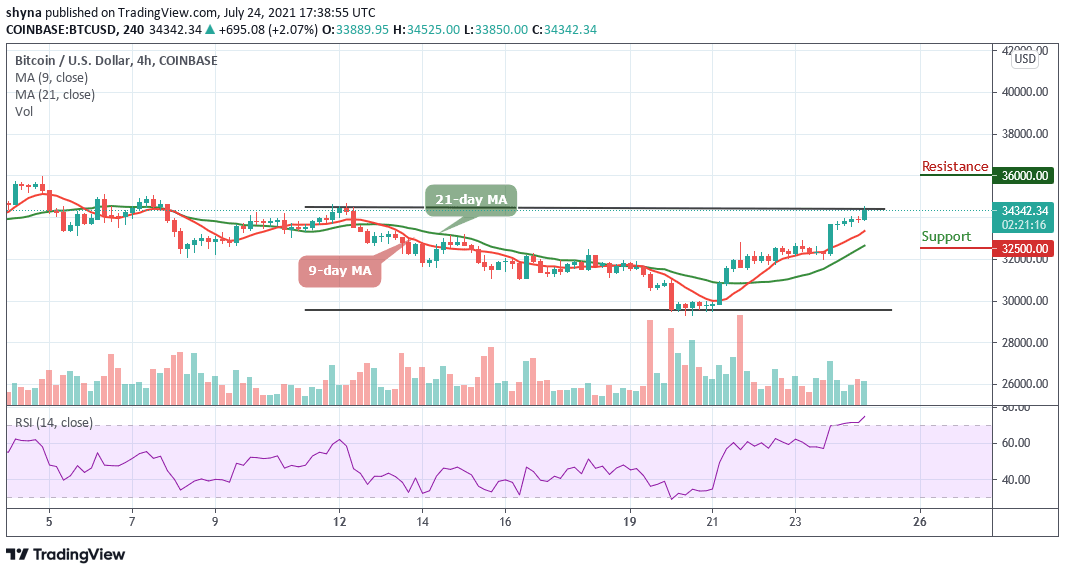
BTC/USD Medium-term Trend: Ranging (4H Chart)
According to the 4-hour chart, the Bitcoin price is seen touching the daily high at $34,525. However, today’s price move happens to be another impressive one as it keeps the coin above the 9-day and 21-day moving averages with a sharp upsurge. Meanwhile, BTC/USD is now maintaining its bull-run above $34,300 as the Relative Strength Index (14) moves into the overbought region.

However, the Bitcoin price may face a downward move if the bulls failed to push the price higher again. Therefore, BTC/USD may drop below the 9-day and 21-day moving averages and could reach critical support at $32,500 and below. Meanwhile, if the bulls find a decent resistance around $35,000, the market may continue to enjoy the bullish movement above the channel at the resistance level of $36,000 and above.
Looking to buy or trade Bitcoin (BTC) now? Invest at eToro!
75% of retail investor accounts lose money when trading CFDs with this provider


