
Bitcoin Price Prediction: BTC/USD Resumes Higher; $60,000 Resistance May Play Out
Bitcoin (BTC) Price Prediction – March 29
Bitcoin is on the brink of breaking towards the $60,000 following a momentous rally that has seen it rise to $58,000.
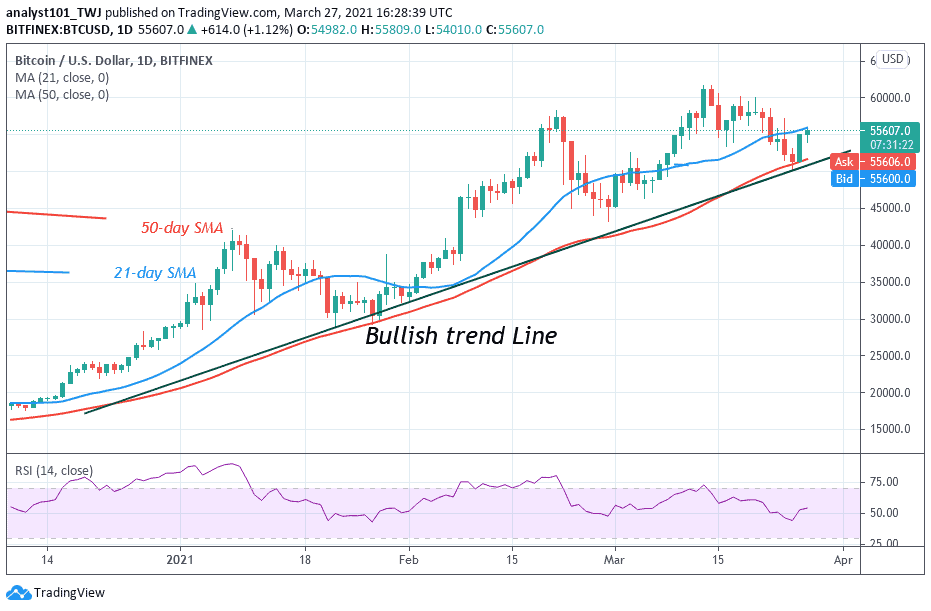
BTC/USD Long-term Trend: Bullish (Daily Chart)
Key levels:
Resistance Levels: $63,000, $65,000, $67,000
Support Levels: $51,000, $49,000, $47,000
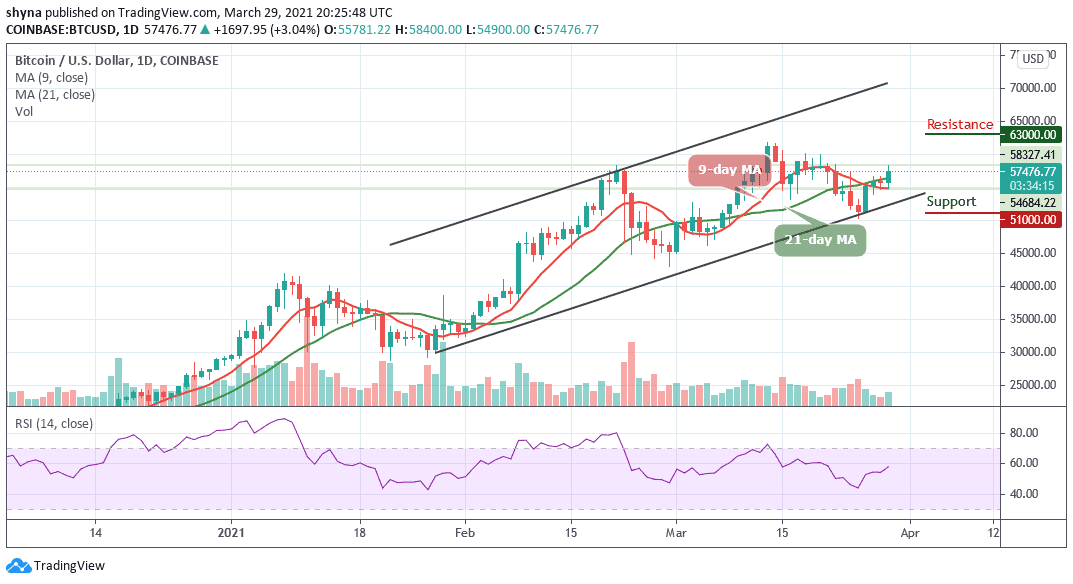
According to the daily chart, BTC/USD breaches $58,000 as the coin trades above the 9-day and 21-day moving averages. The Bitcoin price is likely to revisit the $60,00 distance of forming another new all-time high above the previous high of $61,788, which is quite remarkable.
What to Expect from Bitcoin
After several days of being traded below the moving averages, Bitcoin has been able to clearly break above $57,000 and reach a price per coin of $58,400. The main question is whether it will be able to surpass $58,000 where it may usually find large resistance. Meanwhile, traders are now waiting for a continuation of the bull trend that would help Bitcoin reach new highs.
Moreover, for Bitcoin to would have reached $58,000, this could be the beginning of a new bull run in the crypto space. Meanwhile, as the technical indicator RSI (14) is soaring towards the 60-level, BTC/USD may soon hit the potential resistance levels at $63,000, $65,000, and $67,000 while sliding below the lower boundary of the channel could drag the price to the critical support levels of $51,000, $49,000, and $47,000 respectively.
BTC/USD Medium-term Trend: Bullish (4H Chart)
On the 4-hour chart, BTC/USD is currently trading around $57,363 above the 9-day and 21-day moving averages after a reversal from $54,900 where the market touched today as the price is now moving towards the north.
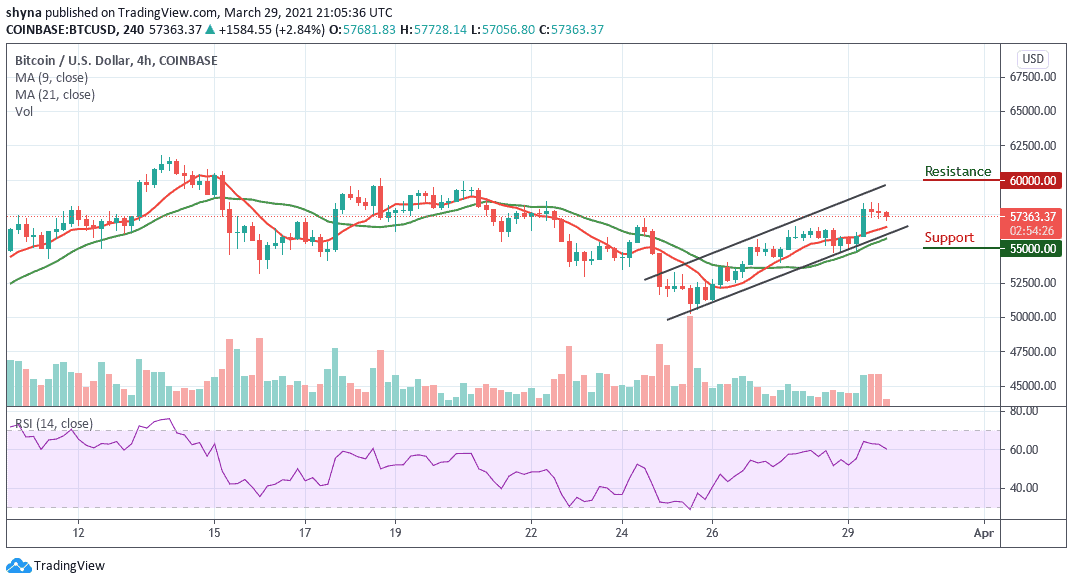
However, if buyers could strengthen the market, they can further push the price above the channel which could allow the market price to test the $60,000 and above. Meanwhile, the technical indicator RSI (14) is making an attempt to cross below 60-level, but any further movement to the south may drag the price to the support level of $55,000 and below.