Bitcoin Price Prediction: BTC/USD Finds Support at $53,000; Ready to Set a Higher High?

Bitcoin (BTC) Price Prediction – April 30
According to the daily chart, the Bitcoin price is seen trying to create a higher low after bouncing at a short-term support level.
BTC/USD Long-term Trend: Ranging (Daily Chart)
Key levels:
Resistance Levels: $60,000, $62,000, $64,000
Support Levels: $48,000, $46,000, $44,000
BTC/USD attempts higher low and since the rejection a couple of days ago. Yesterday, it reached the support level at 369 and began the current bounce and this happens to be the first potential level to act as support in order to create a higher low. However, if it doesn’t hold, the next support levels may be found at $51,000 and $50,000. More so, the technical indicator RSI (14) is starting to show strength as it is in the process of moving towards the 50-level.
What to Expect from Bitcoin (BTC)
However, BTC has yet to reclaim important resistance areas found between $54,500 and $54,834 levels. Until it reclaims this area and validates it as support, traders cannot consider the short-term trend bullish. In that case, a decrease towards the $53,000 support level from the previous chart could remain the most likely scenario.
Furthermore, BTC/USD will have bearish consequences if the bulls fail to break the $55,000 overhead resistance. The market will resume a downward move. For instance, the price may drop to $52,000, and a further downward move to $50,000. If the bears increase the selling pressure, the downward momentum could extend to the supports at $48,000, $46,000, and $44,000 respectively.
Nevertheless, the current bullish movement may likely cross above the 21-day moving average to hit the potential resistance at $60,000, $62,000, and $64,000 levels. To confirm this, the technical indicator RSI (14) is seen moving above 45-level to increase the bullish movement.
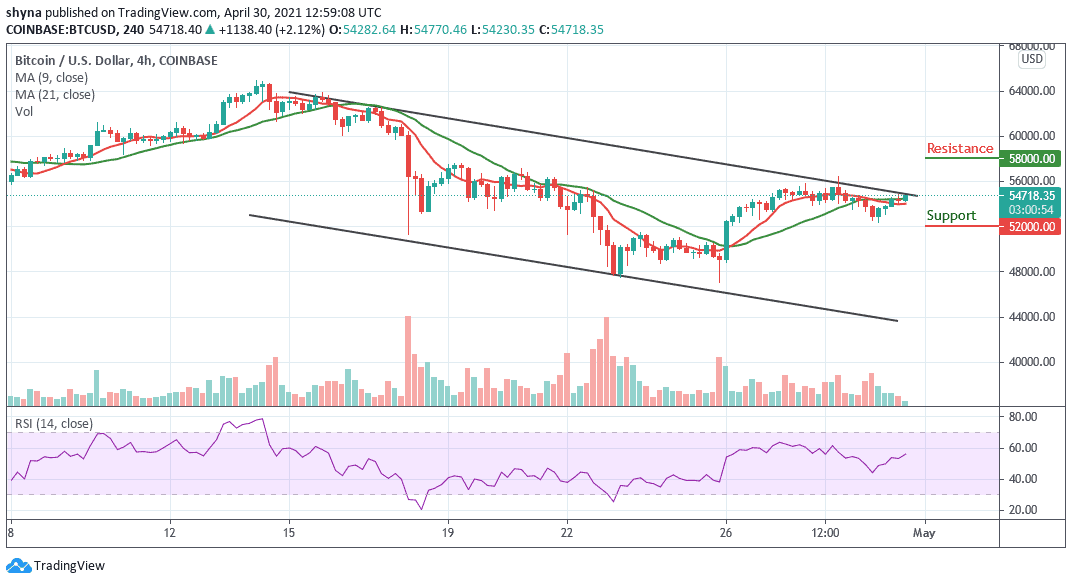
BTC/USD Medium – Term Trend: Ranging (4H Chart)
According to the 4-hour chart, Bitcoin’s price is currently trading at $54,718 as the coin moves above the 9-day and 21-day moving averages after touching the daily high of $54,770. However, traders can see that the bullish movement is still very intact in the market as the technical indicator RSI (14) moves to cross above 60-level.

Moreover, if the buyers could put more pressure and push the price above the upper boundary of the channel, BTC/USD on the 4-hour chart may hit the resistance level of $58,000 and above. But any movement below the moving averages may welcome the sellers into the market and could lead to the support level of $52,000 and below.


