
Bitcoin Price Prediction: BTC/USD Bulls Set To Conquer $45000 Level
Bitcoin Price Prediction – January 12
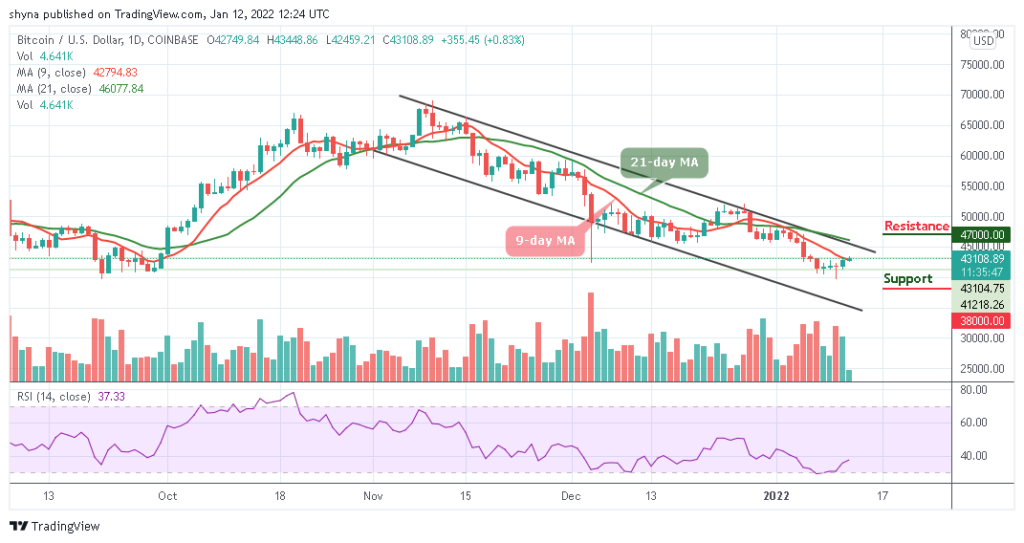
The Bitcoin price prediction shows that BTC is rising for the second straight bullish day as the technical indicator on the daily chart faces the north.
BTC/USD Long-term Trend: Bearish (Daily Chart)
Key levels:
Resistance Levels: $47,000, $49,000, $51,000
Support Levels: $38,000, $36,000, $34,000
BTC/USD is seen pushing the market price above the potential resistance level of $43,000 as bulls need to keep the price above the 9-day moving average at the time of writing. However, the first digital asset could now move with a strong bullish momentum after a sustainable break above an important technical level.
Bitcoin Price Prediction: Would Bitcoin (BTC) Move to the Upside?
Looking at the daily chart, the technical indicator Relative Strength Index (14) is may likely cross above 40-level as the bulls seem to push the coin above the upper boundary of the channel. Moreover, the Bitcoin price seems to be struggling above the 9-day moving average, suggesting that BTC/USD could retreat toward $42,500, before attempting to break higher again. Furthermore, the 21-day moving average continue to edge higher, showing no significant bearish pressure for the time being.
Meanwhile, on the upside, the $43,000 level aligns with the initial resistance. A daily close above this resistance level could lift the price to $47,000, $49,000, and $51,000. In other words, Bitcoin could retreat below the 9-day moving average, currently located at $43,108. However, if it breaks below this level, the critical supports may be located at $38,000, $36,000, and $34,000 respectively.
BTC/USD Medium – Term Trend: Bearish (4H Chart)
According to the 4-hour chart, BTC/USD is currently trading above the 9-day and 21-day moving averages as the coin is likely to cross above the upper boundary of the channel to hit the resistance level of $45,000 and above. But the Bitcoin market is likely to range-bound around the upper boundary of the channel, but the buyers keep the position intact
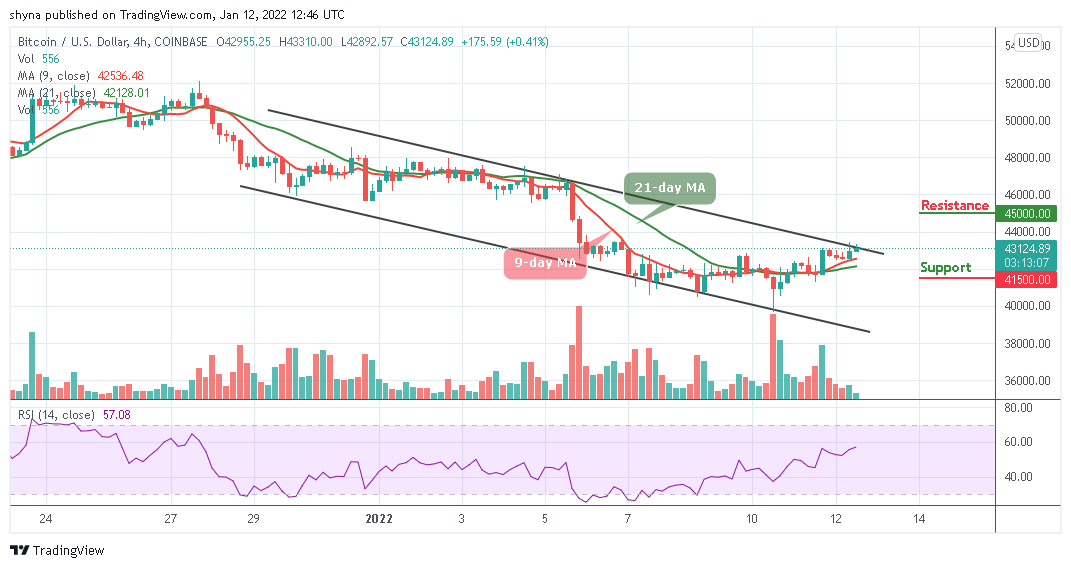
Looking at the Relative Strength Index (14), it shows that BTC price may be ready for the upside. On the contrary, if the coin decides to cross below the 9-day and 21-day moving averages, the support level of $41,500 and below may be located.
Looking to buy or trade Bitcoin (BTC) now? Invest at eToro!
68% of retail investor accounts lose money when trading CFDs with this provider
Read more: