Bitcoin (BTC/USD) Market Holds Below $42,500

Bitcoin Price Prediction – March 21
The recent efforts in the BTC/USD trade upsurges have led the price to encounter resistance above the $40,000 psychological level. The crypto-economic market holds below $42,500 at a closer range point. The maximal and minimal value points within which the market has featured are $41,578 and $40,531 at a percentage of -1.03.
BTC/USD Market
Key Levels:
Resistance levels: $42,500, $45,000, $47,500
Support levels: $37,500, $35,000, $32,500
BTC/USD – Daily Chart
The BTC/USD daily chart showcases the crypto-economic market holds below the $42,500 level over a couple of sessions. The descending triangle yet keeps an intact sense of its purpose as there has been a re-occurrence of variant bearish candlesticks around the bearish trend line drawn. The 50-day SMA indicator is above the 14-day SMA indicator. The Stochastic Oscillators are in the overbought region. And they have crossed their lines southbound near over range 80. That signifies the forces to the north side are likely to start losing momentum in the near time.
Can the BTC/USD trade bulls push more for profits as the market holds below $42,500?
The BTC/USD trade bulls may proceed, pushing price for short-term profiteering basis above the $40,000 psychological level for a while as the crypto market holds below $42,500. The present trading outlook of the crypto-economy doesn’t portend safer trading time for long-position takers. Therefore, they needed to be wary of launching more orders around those points, especially while there is no tangible pressure to back their entries.
On the downside of the technical analysis, the BTC/USD market short-position placers have the brighter advantage of pushing back price downward around high resistance trading levels of $42,500 and $45,000 in an extension. Sudden aggressive emergence of a bearish candlestick engulfing some candlesticks formed between the SMAs will let some late sell orders around the $40,000 level turn into gaining some profits in the long run of that presumed scenario afterward.
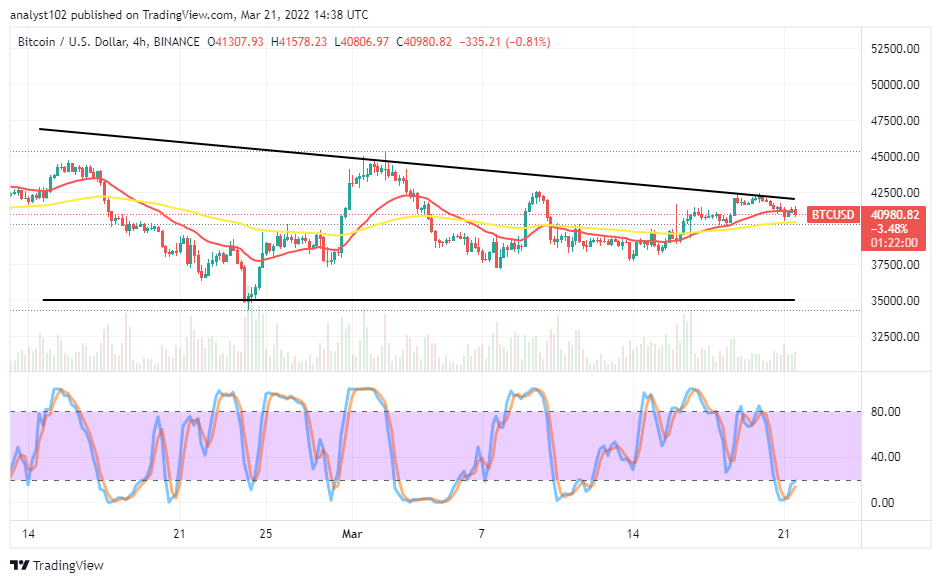
BTC/USD 4-hour Chart
The BTC/USD medium-term chart shows the crypto-economic market holds below the $42,500 trading level. The 14-day SMA indicator is above the 50-day SMA indicator. And they are close to the bearish trend line from the beneath. The Stochastic Oscillators have traveled down into the oversold region. And they now try to point northbound near beneath the range of 20. That suggests the possibility of seeing little upward motions for a while. Traders intending to enter sell orders may have to be on the lookout for a reversal move if it comes to play out to get a sell entry.
Looking to buy or trade Bitcoin (BTC) now? Invest at eToro!
68% of retail investor accounts lose money when trading CFDs with this provider.
Read more:


