Bitcoin (BTC/USD) Market Holds a Lower High at $37,500

Bitcoin Price Prediction – January 26
After a notable line of successive downing motions that occurred recently in the BTC/USD trade operations, the crypto-economic market now holds a lower high at $37,500 over several hours of trading. The crypto’s percentage is at 0.92. Price trades within a high of $37,528 and a low of about $36,607 as of writing.
BTC/USD Market
Key Levels:
Resistance levels: $40,000, $42,500, $45,000
Support levels: $35,000, $32,500, $30,000
BTC/USD – Daily Chart
The BTC/USD daily chart showcases the crypto-economic market holds a lower high at $37,500 in the bearish channel trend lines. The 14-day SMA indicator is beneath the 50-day SMA indicator. And they are above the current trading spot. The Stochastic Oscillators relatively face northbound above the range of 40, attempting to close their lines in the near time. That indicates the possibility of seeing a southward price reversion in no time.
Will the BTC/USD trade still manage to rally to a higher resistance at $40,000 as the crypto market holds a lower high at $37,500?
The BTC/USD trade still appears gathering momentums to the upside. The resistance level at $40,000 can reach in the long run as the crypto market holds a lower high at $37,500. The support trading level at $35,000 may sustain for a while as some downward pressures may resurface purposely for retests around the value line.
On the downside of the technical analysis, the BTC/USD market short-position takers may be having a glaring chance of going for a re-launch of sell orders around the $40,000 resistance. Traders may now have to be alert of spotting active reversal of an upward motion between the resistance value point mentioned earlier and the $37,500 before considering exertion of sell orders if the bearish trend has to continue. 
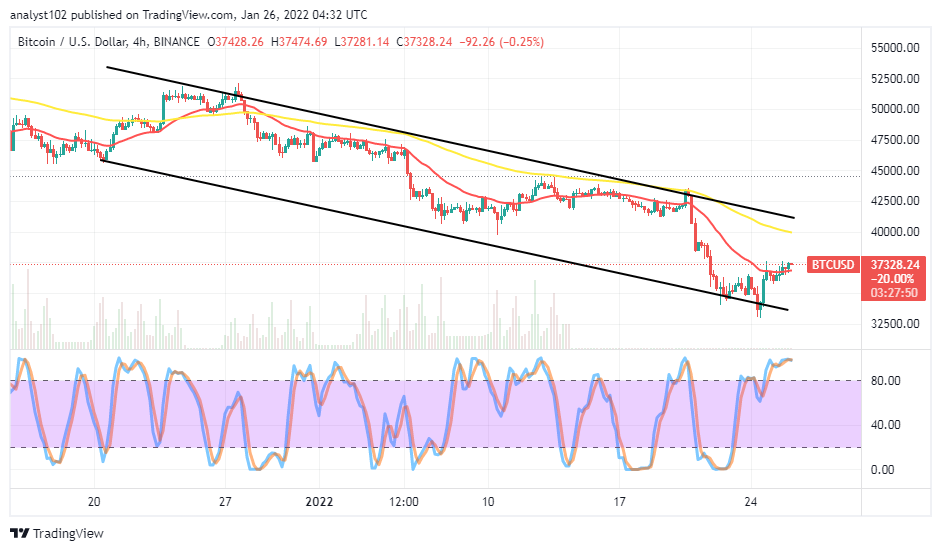
BTC/USD 4-hour Chart
The BTC/USD 4-hour chart shows the crypto market holds a lower high at $37,500 as the price is said to be trading in an overbought condition in the medium-term run presently. The 50-day SMA trend line is above the 14-day SMA trend line in the bearish channels drawn. The Stochastic Oscillators have conjoined their lines, somewhat swerving northbound within it to indicate that a buying pressure is still on. The $40,000 will probably remain an overhead strong resistance zone to the current rallying movements in the long run of the crypto economy.
Looking to buy or trade Bitcoin (BTC) now? Invest at eToro!
68% of retail investor accounts lose money when trading CFDs with this provider.
Read more:


